Figures & data
Figure 1. Summary of the empirical procedure (Source: Own elaboration based on the data described above).
Table 1. Characterizing the study regions.
Table 2. List of variables considered for the macro layer.
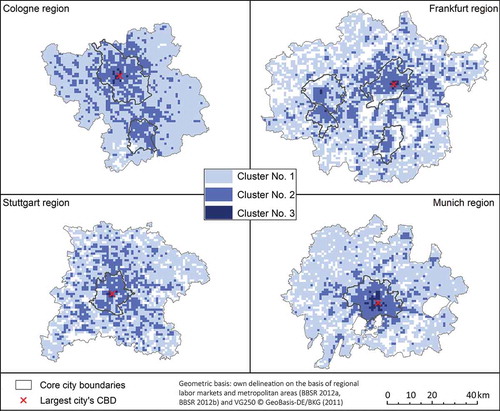
Figure 2. Macro layer based on the mapping of the 3-cluster solution (Source: Own elaboration based on the data described above).
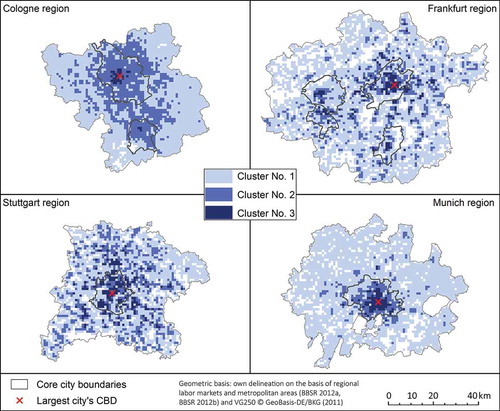
Table 3. Shares of region-wide totals captured by the clusters.
Figure 3. Micro layer (source: Own elaboration based on the data described above).
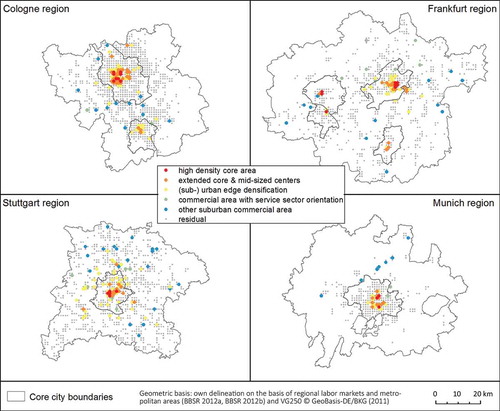
Table 4. Thresholds and descriptions of the micro layer’s types.
Table 5. Region-wide averages for each micro type.
Figure B. Mapping of the 3-cluster solution after a joint analysis of all study regions (Source: Own elaboration based on the data described above).