Figures & data
Figure 1. Map of the Gauteng City-Region with centralities in red, showing primary place names discussed in the article
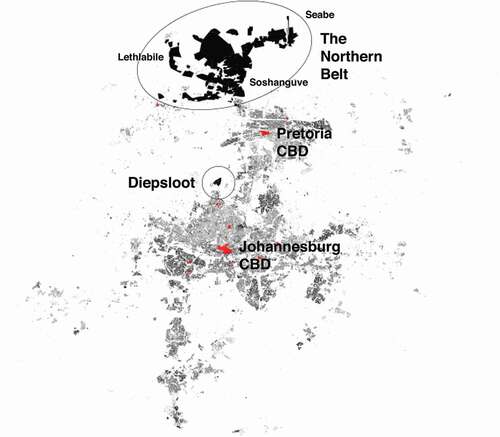
Figure 2. The “cruciform” of the city-region and its peripheral “Bantu residential areas” for nonwhite racial groups, NRDC Red Report, 1957, map no. 19, from Fair (Citation1975) (left). The boundaries of the Bantustans in the 1970s compared to current provincial boundaries, GCRO GIS Map Viewer, http://gcro1.wits.ac.za/gcrojsgis (right)
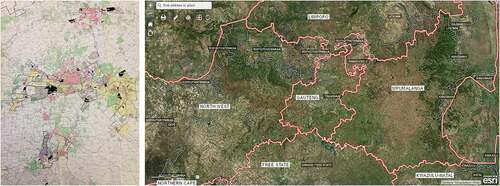
Figure 3. Map of participants in a 2016 study collecting VGI on everyday mobility in the Gauteng City-Region, in which the color of pathways corresponds to income on a color gradient. Major established centralities like the CBDs of Johannesburg (red) contrast with emerging popular centralities for marginalized populations like Diepsloot (orange) and illustrate the continued disconnect between social groups in the GCR
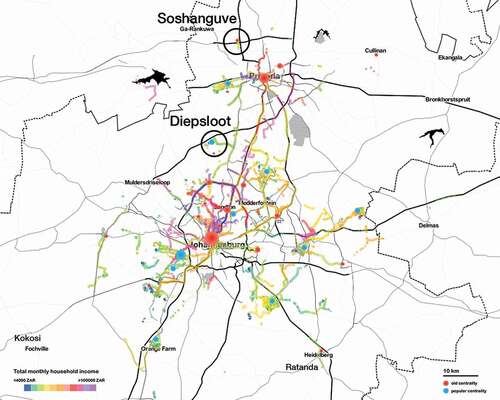
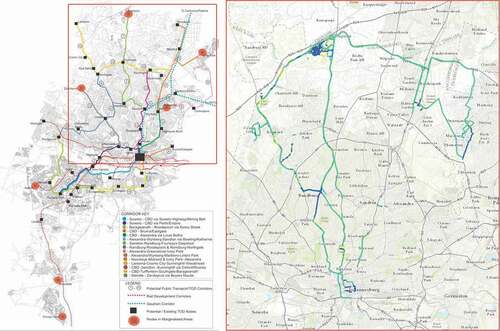
Figure 4. Comparison of the City of Johannesburg’s “Corridors of Freedom” (COF) proposed bus-rapid-transit TOD route connecting Diepsloot to the global financial district of Sandton (left), and the paths people currently take primarily with the minibus taxi system (right). The latter is a map of a volunteered geographic information smartphone study participant, showing multiple modes of transport; dark blue is for walking, green for taxi transport, and yellow for “tilting” when the person was looking at their phone). The COF is a municipality-level plan, and Diepsloot is not a part of TOD plans for the City of Tshwane (Pretoria)