
Figures & data
Figure 1. Micro-renewal projects by province, 2021.
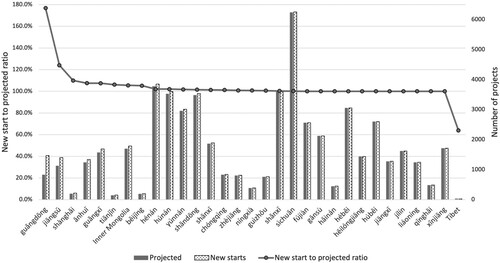
Figure 2. Conceptual framework.
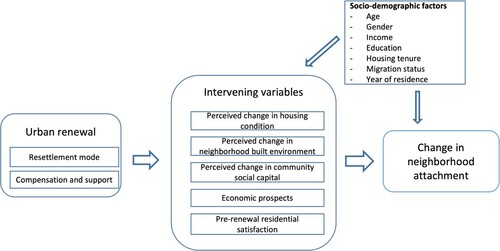
Table 1. The goals and scope of micro-renewal.
Table 2. Case study neighborhoods for survey and interview fieldwork.
Figure 3. Images of two case study neighborhoods (Taken by author in 2021). a: Tancun (redevelopment). b: Yinggang (micro-renewal).
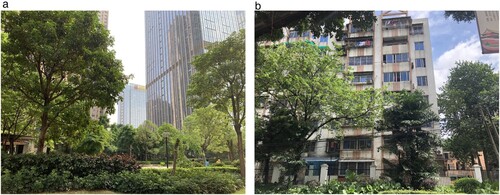
Table 3. Profiles of survey respondents by neighborhood.
Table 4. Key variables in survey data analysis.
Figure 4. (a) Specifications of path analysis Model 1 (Step 1). (b) Specifications of path analysis Model 2 (Step 2).
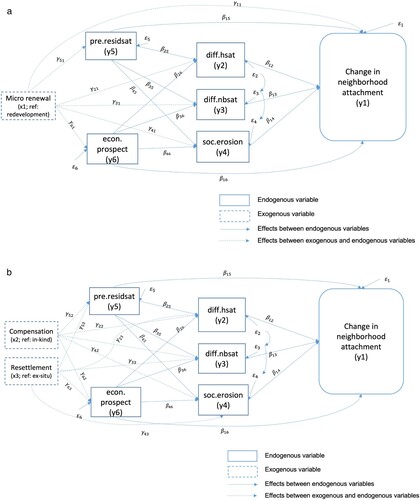
Table 5. Mean change in neighborhood attachment by key variables.
Figure 5. Path analysis result (Model 1), standardized effects.
Notes: ap<0.1; * p<0.05; ** p< 0.01; *** p< 0.001.
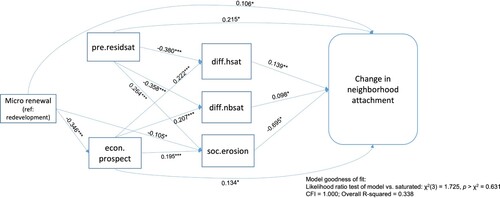
Table 6. Unstandardized effects (Model 1).
Table 6. Continued
Figure 6. Path analysis model result (Model 2), standardized effects.
Notes: ap<0.1; * p<0.05; ** p< 0.01; *** p< 0.001.
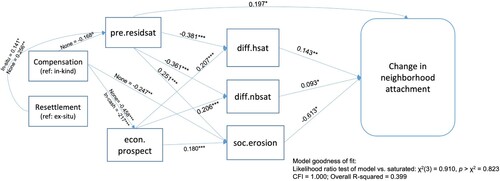
Table 7. Unstandardized effects (Model 2).
Table 7. Contined