Figures & data
Figure 1. Mongla population size and density in relation to other selected cities in Bangladesh (Panel A) and map of Mongla port municipality (Panel B). Source: Juel Mahmud, International Centre for Climate Change and Development (ICCCAD). Map of Mongla created by ICCCAD (used with permission).
Panel 1 is a map showing Mongla port municipality in relation to total population and population densities with other selected cities of Bangladesh. Panel 2 shows the map of Mongla port municipality.
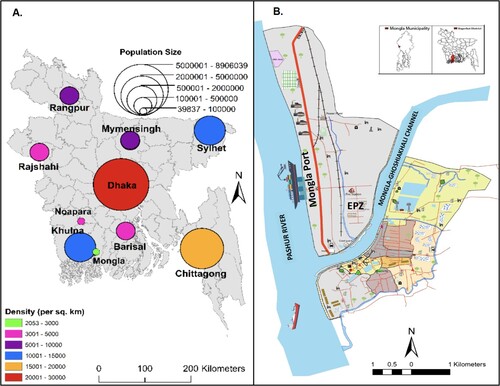
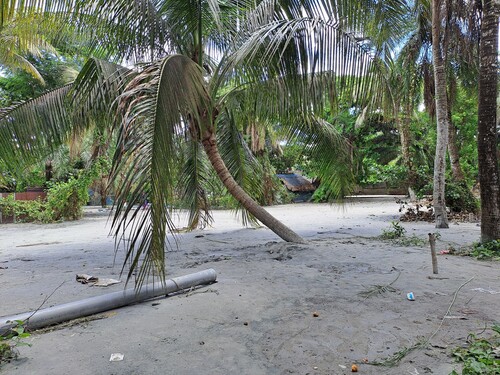
Figure 2. A pond in Mongla recently filled with dredged sand. Source: Photograph taken by M. Feisal Rahman.
A pond in Mongla filled with sand transported by pipeline from the ongoing dredging of the Mongla-Ghosiakhali channel (June 2022). This is a rising trend due to increased demand for land and soaring land prices, and is worsening Mongla residents’ access to freshwater.