Figures & data
Figure 1. Location of the study site within the Clear Fork Watershed east of Lake Benbrook, TX. The hillslope transect (A to A’) and the soil moisture grid (SMG) are shown within the hillslope hollow, along with the basin soils. The profile along the transect (bottom) is adapted from Llado and Slattery (Citation2015). Red squares indicate location of coupled soil moisture (SM) and equitensiometer (EQ) probes.
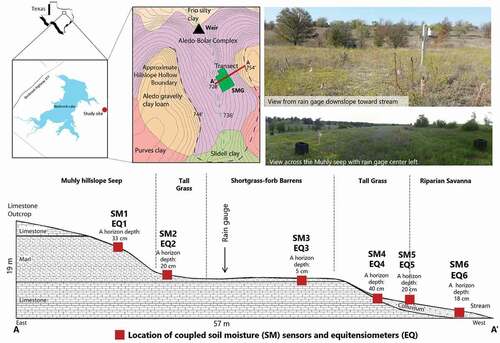
Table 1. Monthly rainfall totals (in mm) from historic data, from Llado and Slattery (Citation2015) study, and from our study (in bold)
Table 2. Storm intensities of different durations for significant precipitation events. * Indicates SWE
Figure 2. Changes in θv content and ψm along the hillslope transect. (a) 9/28/2012 to 11/1/2012; (b) 12/18/2012 to 2/23/2013.
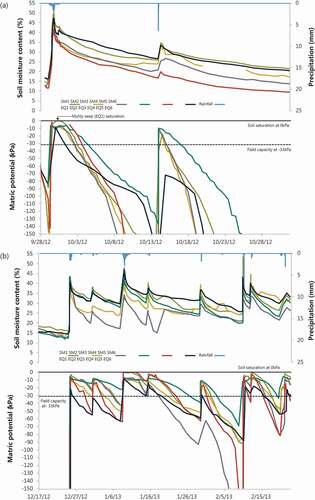
Figure 3. Box plot of volumetric soil moisture content (θv) measured during the entire study period. The diamonds within each box show the statistical mean. Statistical differences between sites was determined using the Mann-Whitney U-test.
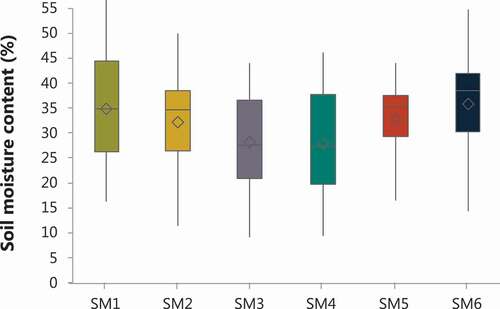
Figure 4. Matric potential (ψm) exceedance curves derived from equitensiomer data along the experimental hillslope transect for the 20-month study period. Field capacity (−33kPa) is represented by the dashed line.
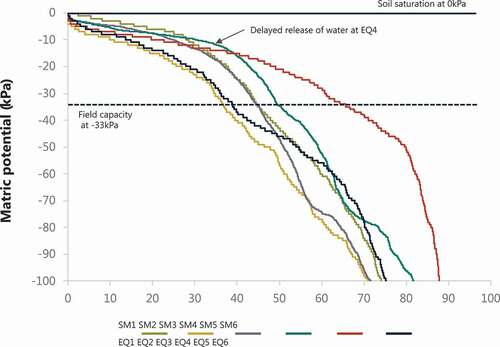
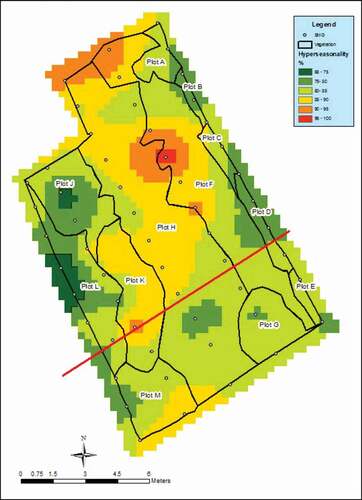
Figure 5. Fall vegetative plots surveyed and labeled alphabetically across the SMG. Transect shown in red with paired moisture probes and equitensiometers. Species in each plot were selected according to cover class dominance and species distinguishing plots from adjacent plots.
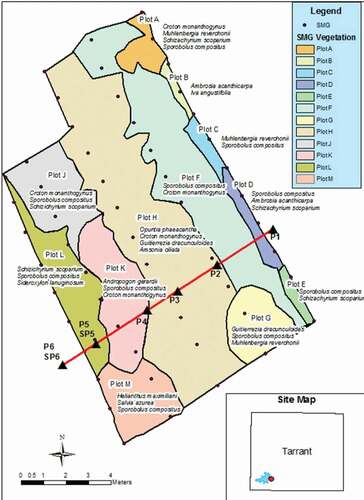
Figure 6. Vegetative plots overlaying (a) wettest, (b) moderate, and (c) driest SMGs. The transect is indicated by the red line. Vegetation plots correspond with Fig 6.
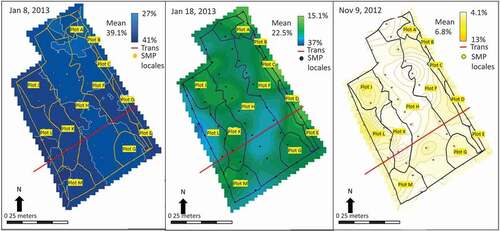
Figure 7. Vegetation plots over % hyperseasonality raster. The red line indicates the hillslope transect.