
Figures & data
Figure 1. Location of Sirajganj Sadar adjacent to the Jamuna river. Inset map showing the presence of the site in Bangladesh.
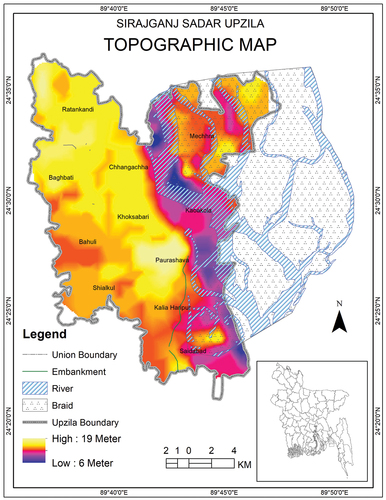
Figure 2. Methodological flowchart of supervised classification technique.
Figure 3. Land cover types and land-use changes of Sirajganj Sadar in the years of 1972, 1980, 1993, 2003, and 2013 using unsupervised classification technique. The cyan color representing the river courses, the brick color showing the existence of settlement and homestead vegetation, and the gray color stands for the char land in the area.
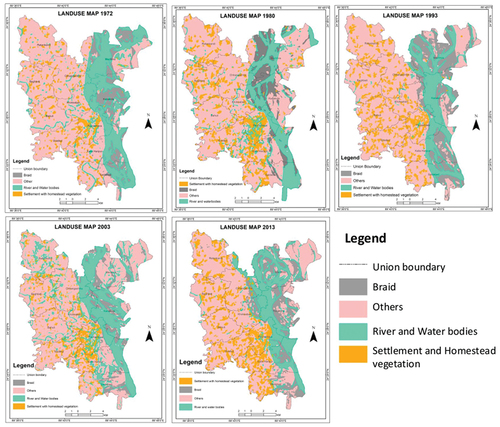
Figure 4. Land cover types and land-use changes of Sirajganj Sadar in the years of 1972, 1980, 1993, 2003, and 2013 using supervised classification technique. The cyan color representing the river courses, the brick color showing the existence of settlements and homestead vegetation, and the gray color stands for the char land in the area.
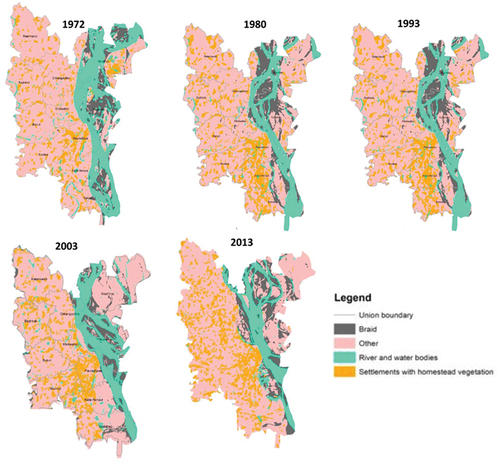
Figure 5. Total land-use area and their prominent fluctuations in 1972, 1980, 1993, 2003, 2013 using unsupervised classification algorithm.
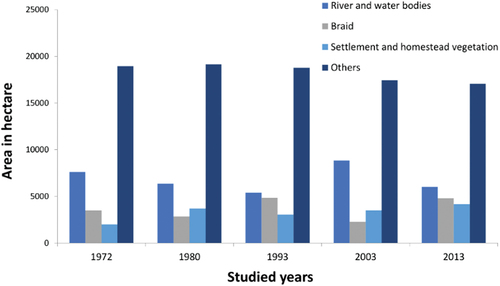
Figure 6. Total land-use area and their prominent fluctuations in 1972, 1980, 1993, 2003, and 2013 using supervised classification algorithm.
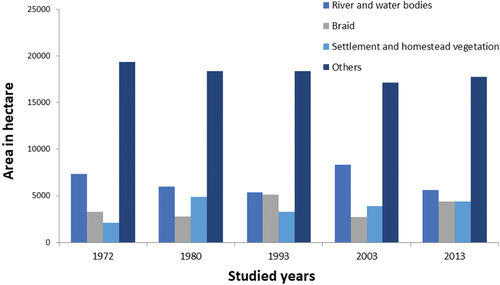
Table 1. Unsupervised classification accuracies examined by error matrix of κ coefficients.
Table 2. Supervised classification accuracies examined by error matrix of κ coefficients.
Table 3. Erosional landmass area of Sirajganj Sadar based on the local union.
Table 4. Depositional landmass area of Sirajganj Sadar based on the local union.
Figure 7. Snaps from land use map showing image classification accuracy pixels to pixels from satellite image to classified image.
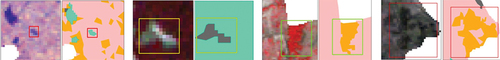
Figure 8. Erosional activity of Jamuna river in Sirajganj Sadar during the last four decades of 1972 to 2013.
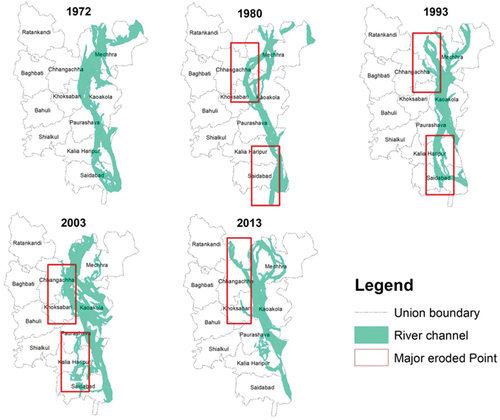
Figure 9. Total depositional activity of Jamuna river in Sirajganj Sadar during the last four decades of 1972 to 2013.
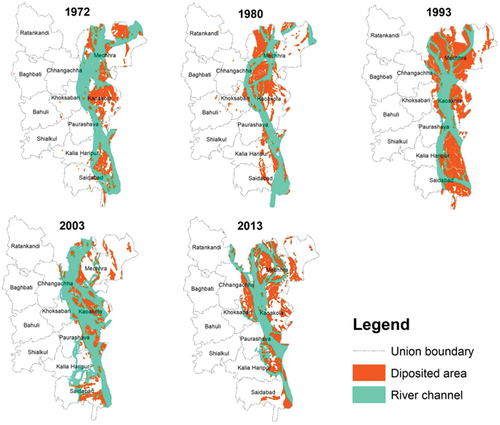
Figure 10. The physiognomies of erosion and depositional process in Sirajganj Sadar. The vertical axis is the local unit of Sirajganj Sadar, and the horizontal axis is the area of total erosion and deposition in hectares within the four decades.
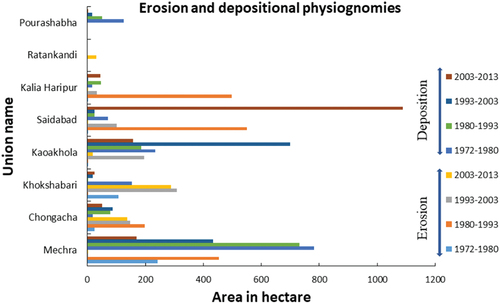
Figure 11. Pattern and comparison of river course and west bank shifting of Jamuna River in Sirajganj Sadar from 1972–2013. The red boxes showing the erosion point on the west bank of the river.
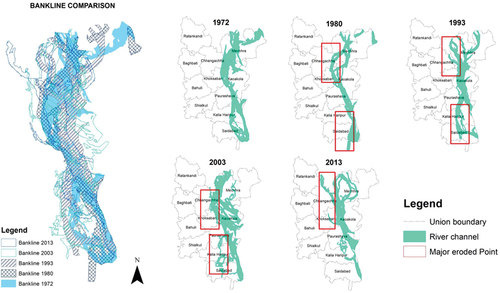
Figure 12. Settlement displacement scenarios of Sirajganj Sadar due to erosion and depositional activities of Jamuna river from 1972–2013.
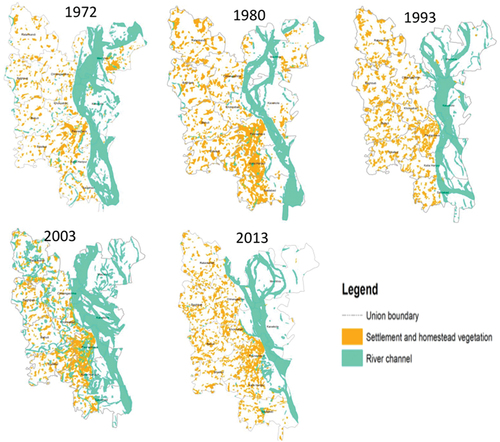
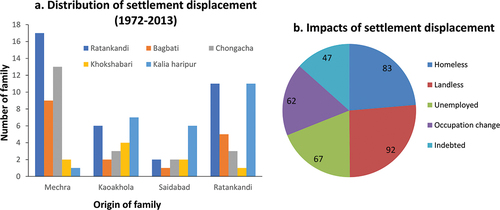
Figure 13. Impacts of settlement displacement; a. distributions of settlement displacement from eroded place to other places, b. lateral impacts of settlement displacement.
Data availability statement
Data will be made available if asked and required.