Figures & data
Figure 1. Map showing the location and nature of 84 documented soft capping projects and trials, with inset map of sites in Britain and Ireland. Two notable natural soft cap growth sites are also included.
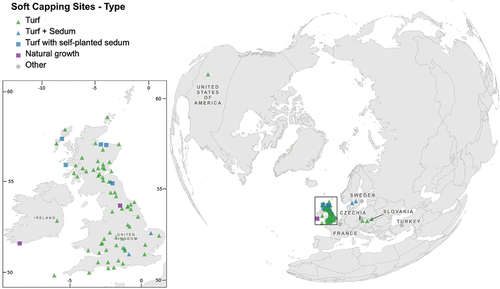
Figure 2. Sedum-based soft capping on masonry at (a) Godstow Abbey, Wolvercote, Oxford, England (Listed Grade II) installed in 2009 using sedum matting and (b) test walls in Wytham Woods, Oxfordshire, England, where sedum plugs were installed in 2008 around the cap edge (Wood et al., Citation2018). Areas primarily populated with sedums are highlighted with white dashed lines.
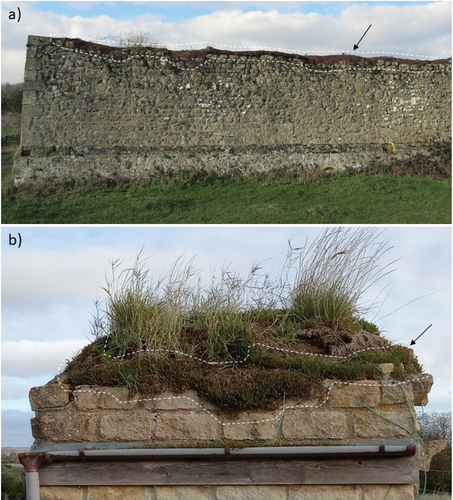
Figure 3. Schematic of (a) model inputs, (b) model runs, (c) model outputs and (d) data analysis used in this study to generate modelled presence likelihoods for four soft capping species (Sedum album, S. acre, S. anglicum and Saxifraga granulata).
Table 1. Rationale of record inclusion criteria.
Figure 4. Comparative cumulative distributions of presence probabilities for terrestrial grid cells across Britain and Ireland with records for: (a) Sedum album, (b) S. acre, (c) S. anglicum and (d) Saxifraga granulata. The presence probabilities associated with 2% and 20% of the locations with a record of species presence are indicated with dot-dashed and dashed lines, respectively. Values below the 2% threshold, between 2 and 20% thresholds and above the 20% threshold are associated with a weak, moderate and strong likelihood of survival, respectively.
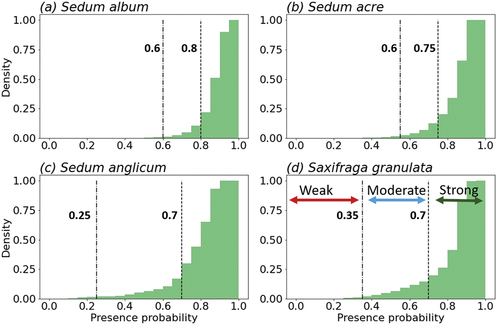
Figure 5. Habitat suitability for Sedum album, S. acre, S. anglicum and Saxifraga granulata in the recent past (1970–2000) and under low and high emission scenarios for mid- and end-century. Areas are coloured according to whether they have a strong (green), moderate (blue) or weak (red/brown) likelihood of presence.
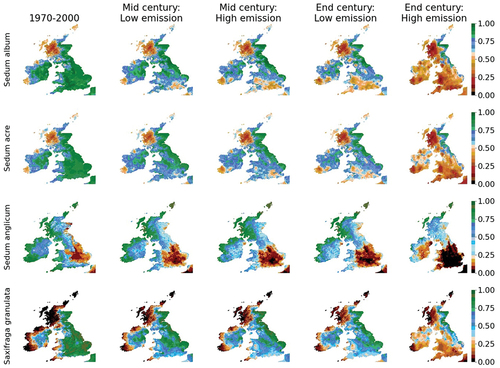
Figure 6. Percentage of land area in England (a, e, i, m), Wales (b, f, j, n), Scotland (c, g, k, o) and Ireland (d, h, l, p) with a weak (red), moderate (blue) or strong (green) likelihood for Sedum album (a-d), S. acre (e-h), S. anglicum (i-l) and Saxifraga granulata (m-p) presence in the recent past (1970–2000), by mid-century and by end-century under low and high emission scenarios. Histograms showing the distributions of presence probabilities are provided in Figures S5–S8.
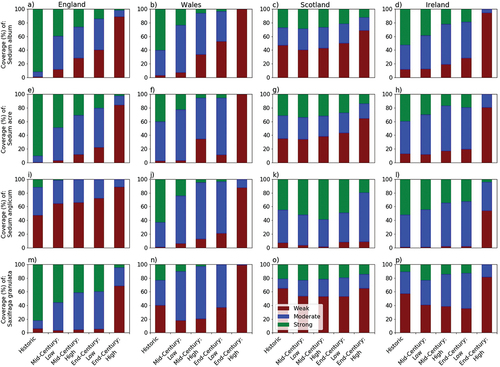
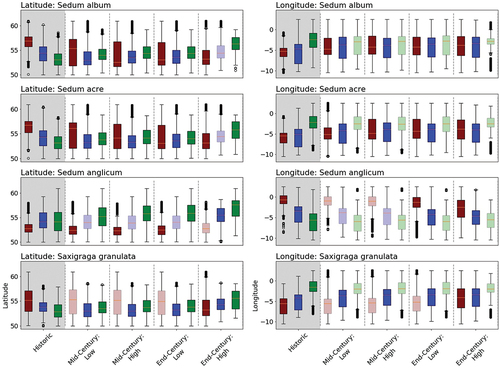
Figure 7. The latitudinal and longitudinal distribution of weak (red), moderate (blue) and strong (green) likelihoods under historic and future scenarios. Future distributions with notable change (as defined in section Thresholds) are shown in bold/opaque colours, while distributions with no notable change are shown with transparent colours.