1,257
Views
40
CrossRef citations to date
0
Altmetric
ARTICLES

Preliminary observations on the bone microstructure, growth patterns, and life habits of some Triassic temnospondyls from India

, &
Pages 78-93 | Received 23 Sep 2008, Accepted 15 Mar 2009, Published online: 28 Jan 2010

Figures & data

FIGURE 1 Major Gondwana basins of peninsular India and representative vertical lithologs of A, Early Triassic Panchet Formation showing trematosaurid-bearing horizon; B, Middle Triassic Denwa Formation showing paracyclotosaurid-bearing horizon; C, Late Triassic Maleri Formation showing chigutisaurid-bearing horizon; D, Gondwana stratigraphy of the basins (after CitationKutty et al., 1987; CitationChakraborty et al., 2003). Fossil-bearing horizons are marked by asterisks. Inset shows the relative positions of the Gondwana outcrops within India. For the vertical lithologs, the x axis denotes grain size ranging from clay (cl) and silt (s) to various sand sizes such as fine (f), medium (m), coarse (c), and pebbly (p); the y axis denotes height in meters.
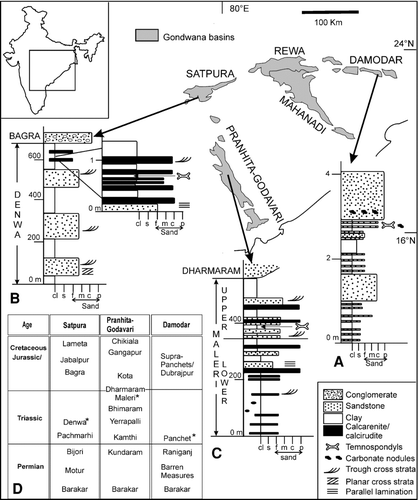
FIGURE 1 Major Gondwana basins of peninsular India and representative vertical lithologs of A, Early Triassic Panchet Formation showing trematosaurid-bearing horizon; B, Middle Triassic Denwa Formation showing paracyclotosaurid-bearing horizon; C, Late Triassic Maleri Formation showing chigutisaurid-bearing horizon; D, Gondwana stratigraphy of the basins (after CitationKutty et al., 1987; CitationChakraborty et al., 2003). Fossil-bearing horizons are marked by asterisks. Inset shows the relative positions of the Gondwana outcrops within India. For the vertical lithologs, the x axis denotes grain size ranging from clay (cl) and silt (s) to various sand sizes such as fine (f), medium (m), coarse (c), and pebbly (p); the y axis denotes height in meters.

TABLE 1 Stratigraphic horizon, measured length, calculated cortical thickness, and cortical porosity of the skeletal elements examined.

FIGURE 2 A, Schematic representation of a temnospondyl based on the reconstruction of Mastodonsaurus (not to scale, adapted from CitationSchoch and Milner, 2000) showing the different types of bones (in dark shade) examined for bone histology. Note that the bones examined are not from a single individual. BL, available skeletal elements studied: B–C, Trematosauridae, B, ISIA181/3, humerus; C, ISIA181/2, femur; D–G, Indeterminate Temnospondyli, D, ISIA181/1, humerus; E, ISIA181/4, rib; F, ISIA181/5, rib; G, ISIA181/6, rib; H–K, Paracyclotosauridae, H, ISIA181/7, humerus; I, ISIA181/8, femur; J, ISIA181/9, tibia; K, ISIA181/10, rib; L, Chigutisauridae, ISIA181/14, intercentrum. Note that not all the elements examined are given in the figure. Scale applies to BL. M, schematic representation of a transverse section of a bone showing the calculation of cortical thickness (RBT%) and k-values (after Wall, 1983; Curry and Alexander, 1985; CitationChinsamy, 1993). N, field of view of a femoral transverse section showing the calculation of porosity (shaded in grey) as a percentage of total cortical area (after CitationChinsamy, 1993).
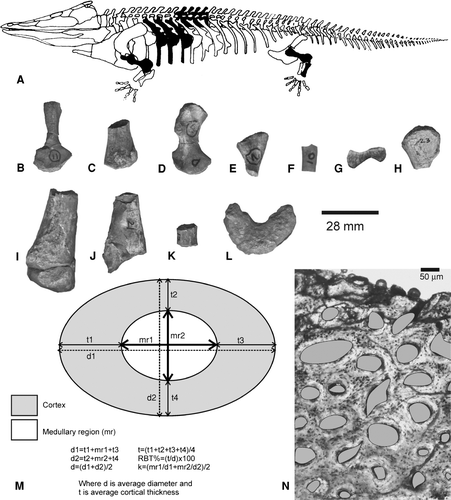
FIGURE 2 A, Schematic representation of a temnospondyl based on the reconstruction of Mastodonsaurus (not to scale, adapted from CitationSchoch and Milner, 2000) showing the different types of bones (in dark shade) examined for bone histology. Note that the bones examined are not from a single individual. B–L, available skeletal elements studied: B–C, Trematosauridae, B, ISIA181/3, humerus; C, ISIA181/2, femur; D–G, Indeterminate Temnospondyli, D, ISIA181/1, humerus; E, ISIA181/4, rib; F, ISIA181/5, rib; G, ISIA181/6, rib; H–K, Paracyclotosauridae, H, ISIA181/7, humerus; I, ISIA181/8, femur; J, ISIA181/9, tibia; K, ISIA181/10, rib; L, Chigutisauridae, ISIA181/14, intercentrum. Note that not all the elements examined are given in the figure. Scale applies to B–L. M, schematic representation of a transverse section of a bone showing the calculation of cortical thickness (RBT%) and k-values (after Wall, 1983; Curry and Alexander, 1985; CitationChinsamy, 1993). N, field of view of a femoral transverse section showing the calculation of porosity (shaded in grey) as a percentage of total cortical area (after CitationChinsamy, 1993).

FIGURE 3 Early Triassic temnospondyls. A–B, Trematosauridae, ISIA181/3, humerus, showing A, a thick cortex surrounding a large medullary region. Note the presence of a peripheral zone of avascular lamellar bone, which is separated by a prominent LAG (arrow) from the fibrolamellar bone in the inner cortex; B, inset of A at higher magnification showing the LAG (arrow); CD, Trematosauridae, ISIA181/2, femur, showing C, fibrolamellar bone in the cortex and bony trabeculae in the medullary region. White arrow indicates a reversal line in the perimedullary region; D, inset of C at higher magnification showing fibrolamellar bone tissue and a decrease in cortical vascularity towards the periosteal periphery. White arrows indicate discrete longitudinally oriented primary osteons whereas black arrows indicate globular osteocite lacunae; E–F, Temnospondyli indet., ISIA181/1, cortical region of humerus showing E, fibrolamellar bone in deeper cortex and parallel fibered bone at the periosteal periphery. Arrows indicate primary vascular channels; F, radiating vascular channels (arrows) in the region of the deltopectoral crest. All figures are of transverse sections. Scale bars equal 300 μm.
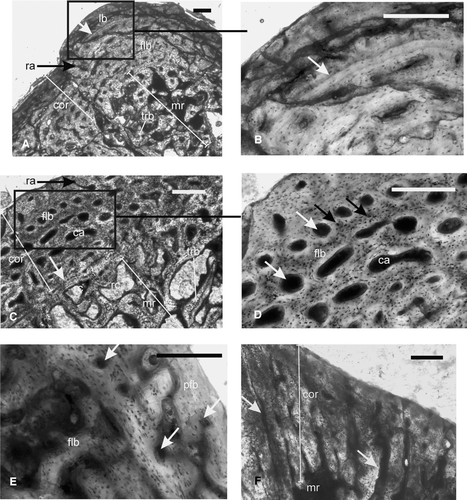
FIGURE 3 Early Triassic temnospondyls. A–B, Trematosauridae, ISIA181/3, humerus, showing A, a thick cortex surrounding a large medullary region. Note the presence of a peripheral zone of avascular lamellar bone, which is separated by a prominent LAG (arrow) from the fibrolamellar bone in the inner cortex; B, inset of A at higher magnification showing the LAG (arrow); C–D, Trematosauridae, ISIA181/2, femur, showing C, fibrolamellar bone in the cortex and bony trabeculae in the medullary region. White arrow indicates a reversal line in the perimedullary region; D, inset of C at higher magnification showing fibrolamellar bone tissue and a decrease in cortical vascularity towards the periosteal periphery. White arrows indicate discrete longitudinally oriented primary osteons whereas black arrows indicate globular osteocite lacunae; E–F, Temnospondyli indet., ISIA181/1, cortical region of humerus showing E, fibrolamellar bone in deeper cortex and parallel fibered bone at the periosteal periphery. Arrows indicate primary vascular channels; F, radiating vascular channels (arrows) in the region of the deltopectoral crest. All figures are of transverse sections. Scale bars equal 300 μm.

FIGURE 4 Temnospondyli indet, ribs. AC, ISIA181/5, showing A, a thick compact cortex surrounding a medullary region; B, inset I of A at higher magnification showing woven fibered bone matrix and longitudinally oriented primary vascular channels (arrow); C, inset II of A showing large resorption cavities (arrow) in the perimedullary region; D–F, ISIA181/6, showing D, woven fibered bone matrix with primary vascular channels (arrow) in the cortex; E–F, profuse radially arranged vascular channels; F, inset of E at higher magnification. Arrows indicate two sets of radially arranged vascular channels; one running from the inner to mid cortex and the other from mid to outer cortex. All figures are of transverse sections. Scale bars equal 300 μm.
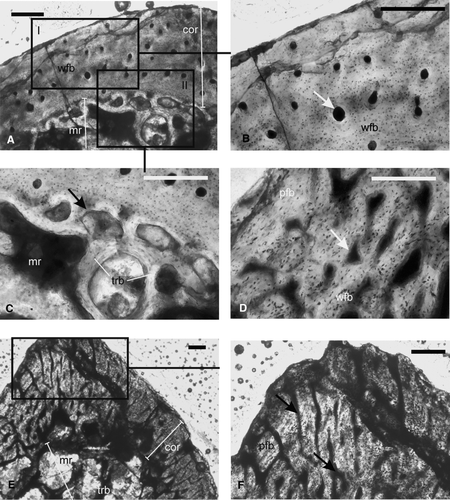
FIGURE 4 Temnospondyli indet, ribs. A–C, ISIA181/5, showing A, a thick compact cortex surrounding a medullary region; B, inset I of A at higher magnification showing woven fibered bone matrix and longitudinally oriented primary vascular channels (arrow); C, inset II of A showing large resorption cavities (arrow) in the perimedullary region; D–F, ISIA181/6, showing D, woven fibered bone matrix with primary vascular channels (arrow) in the cortex; E–F, profuse radially arranged vascular channels; F, inset of E at higher magnification. Arrows indicate two sets of radially arranged vascular channels; one running from the inner to mid cortex and the other from mid to outer cortex. All figures are of transverse sections. Scale bars equal 300 μm.

FIGURE 5 Paracyclotosauridae. A–B, ISIA181/7, humerus showing A, lamellar bone as the primary tissue of the cortex; arrow indicates the parallel network of the longitudinally oriented vascular channels; B, asymmetric extension (indicated by a white arrow) of secondary reconstruction towards the deltopectoral crest; C, ISIA181/8, femur showing predominantly lamellar bone in the cortex; note the large resorption cavities in the perimedullary region. All figures are of transverse sections. Scale bars equal 300 μm.
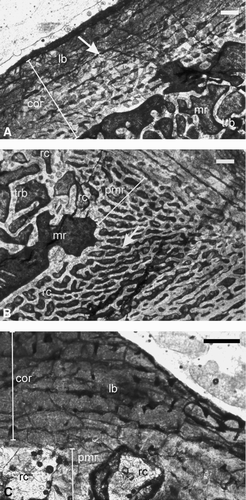
FIGURE 5 Paracyclotosauridae. A–B, ISIA181/7, humerus showing A, lamellar bone as the primary tissue of the cortex; arrow indicates the parallel network of the longitudinally oriented vascular channels; B, asymmetric extension (indicated by a white arrow) of secondary reconstruction towards the deltopectoral crest; C, ISIA181/8, femur showing predominantly lamellar bone in the cortex; note the large resorption cavities in the perimedullary region. All figures are of transverse sections. Scale bars equal 300 μm.

FIGURE 6 Paracyclotosauridae. A–B, ISIA181/9, tibia showing A, a narrow cortex composed of lamellar bone surrounding a large medullary region. Note the presence of bony trabeculae in the medullary region. Arrows indicate longitudinally oriented vascular channels. B, radially arranged vascular channels (arrow) at the cnemial crest; C–D, ISIA181/10, rib showing C, a thick compact cortex surrounding the medullary region. Black arrow indicates the irregular periosteal periphery. White arrow indicates radial channels in the deeper cortex. D, peripheral lamellar bone and woven fibered bone in the deeper cortex. E, ISIA181/11, intercentrum showing a compact cortex containing avascular lamellar bone and three LAGs (arrows), surrounding a medullary region. Note the presence of bony trabeculae of the cancellous bone in the medulla. F, ISIA181/12, intercentrum showing Sharpeys’ fibers (arrows) and radially arranged vascular channels in the cortex. All figures are of transverse sections. Scale bars equal 300 μm.
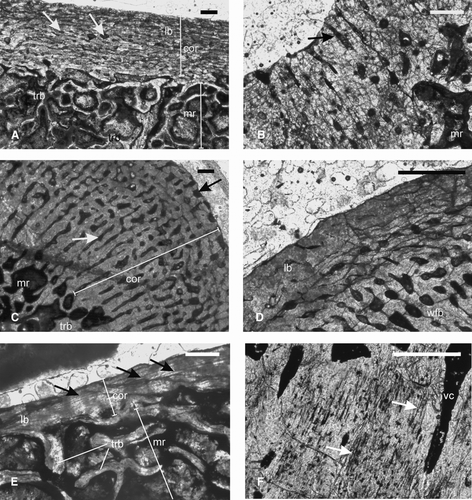
FIGURE 6 Paracyclotosauridae. A–B, ISIA181/9, tibia showing A, a narrow cortex composed of lamellar bone surrounding a large medullary region. Note the presence of bony trabeculae in the medullary region. Arrows indicate longitudinally oriented vascular channels. B, radially arranged vascular channels (arrow) at the cnemial crest; C–D, ISIA181/10, rib showing C, a thick compact cortex surrounding the medullary region. Black arrow indicates the irregular periosteal periphery. White arrow indicates radial channels in the deeper cortex. D, peripheral lamellar bone and woven fibered bone in the deeper cortex. E, ISIA181/11, intercentrum showing a compact cortex containing avascular lamellar bone and three LAGs (arrows), surrounding a medullary region. Note the presence of bony trabeculae of the cancellous bone in the medulla. F, ISIA181/12, intercentrum showing Sharpeys’ fibers (arrows) and radially arranged vascular channels in the cortex. All figures are of transverse sections. Scale bars equal 300 μm.

FIGURE 7 Chigutisauridae. A–B, ISIA41, humerus, showing A, lamellar bone as the primary cortical tissue with three LAGs (arrows) and resorption cavities in the perimedullary region; B, extensive secondary reconstruction as evidenced by large resorption cavities and secondary osteon (arrow); C, ISIA181/13, a rib showing lamellar bone in the outer cortex and woven fibered bone in the inner cortex. Note the irregular periosteal periphery (black arrow) and large erosion cavities (white arrow) in the perimedullary region. D, ISIA181/14, intercentrum showing a narrow cortex containing lamellar bone. All figures are of transverse sections. Scale bars equal 300 μm.
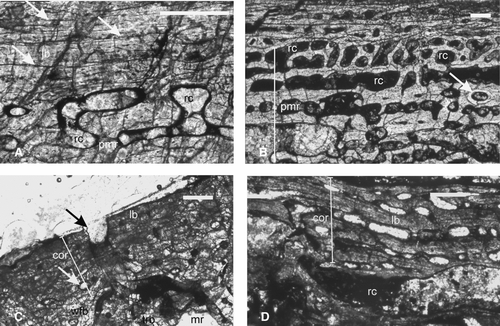
FIGURE 7 Chigutisauridae. A–B, ISIA41, humerus, showing A, lamellar bone as the primary cortical tissue with three LAGs (arrows) and resorption cavities in the perimedullary region; B, extensive secondary reconstruction as evidenced by large resorption cavities and secondary osteon (arrow); C, ISIA181/13, a rib showing lamellar bone in the outer cortex and woven fibered bone in the inner cortex. Note the irregular periosteal periphery (black arrow) and large erosion cavities (white arrow) in the perimedullary region. D, ISIA181/14, intercentrum showing a narrow cortex containing lamellar bone. All figures are of transverse sections. Scale bars equal 300 μm.

TABLE 2 Histological characteristics and growth patterns of the Triassic temnospondyls examined.

FIGURE 8 Comparative bar diagram showing cortical thickness (RBT%) in different skeletal elements of the temnospondyls.
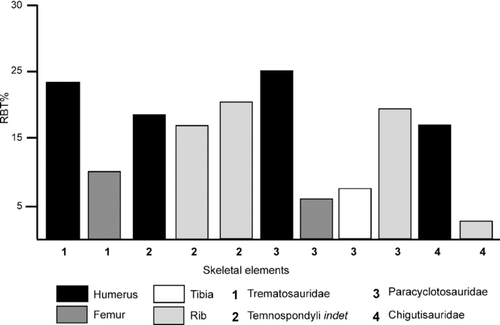
FIGURE 8 Comparative bar diagram showing cortical thickness (RBT%) in different skeletal elements of the temnospondyls.

Reprints and Corporate Permissions

Please note: Selecting permissions does not provide access to the full text of the article, please see our help page How do I view content?

To request a reprint or corporate permissions for this article, please click on the relevant link below:

Academic Permissions

Please note: Selecting permissions does not provide access to the full text of the article, please see our help page How do I view content?

Obtain permissions instantly via Rightslink by clicking on the button below:

If you are unable to obtain permissions via Rightslink, please complete and submit this Permissions form. For more information, please visit our Permissions help page.