Figures & data
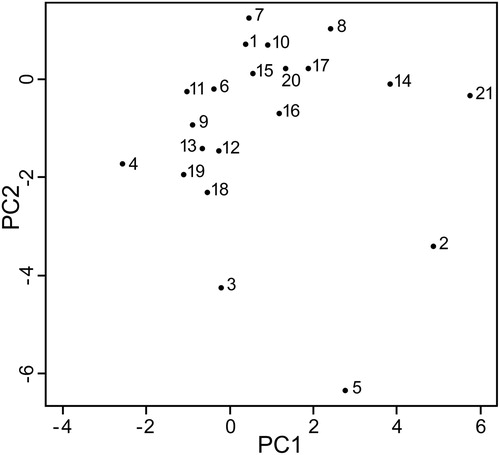
FIGURE 1. Leptarctus primus skull reconstructions and models. A, AMNH FM 25385, reconstruction of missing or damaged morphology, accounted for in virtual reconstruction: occipital condyles, anterior cranial crushing, and a loss of maxillary canines. The protrusion of the left sagittal crest has broken off; it has not been reattached. The neotype (AMNH FM 18241) of L. primus was used as a reference for the reconstruction. B, CT-scanned, evaluated to identify collapsed elements and holes, and slice artifacts produced by the coronal image stack compilation smoothed in Mimics to create a computerized model of the original skull. C, model B’s triangular surface elements lowered via the ‘decimation function’ to a more uniform number (between 200,000 and 280,000 finite elements), reducing the topical quality of the mesh but standardizing it with other models. Because canines are lacking in AMNH FM 18241, the canines were transferred digitally from the best-preserved Leptarctus specimen (AMNH FM 54198) in the collection. Refer to Supplemental Data for more information on craniodental reconstruction methodologies.
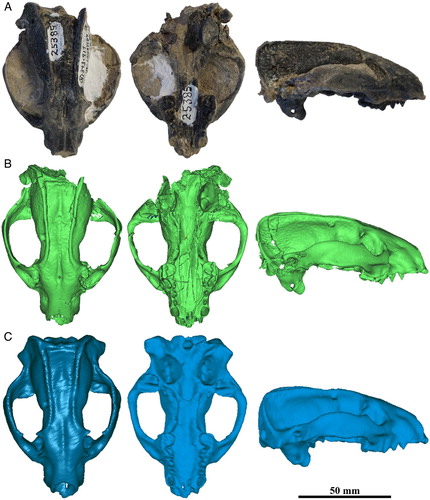
FIGURE 2. Phylogeny of the 21 species modeled and analyzed in this study, generated as a composite tree in Mesquite using Flynn et al. (Citation2005) for the base phylogenetic tree, Koepfli et al. (Citation2008) for additional extant musteloid taxa, as well as Wesley-Hunt and Flynn (2005) and Spaulding and Flynn (Citation2012) for the fossil carnivoramorphans Thinocyon velox and Oodectes herpestoides, respectively. Leptarctus primus was placed as unresolved within Musteloidea. See text for list of models taken from previous studies. Superscripted daggers indicate extinct species.
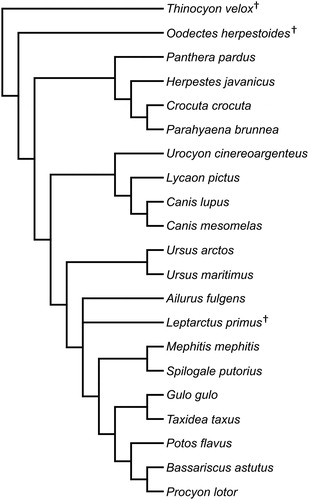
FIGURE 3. A, plot of mechanical efficiency (ME) versus adjusted strain energy (SE) of unilateral bite simulations at all tooth loci present on all 21 species FE models. Darker-shade (red) solid curves are ecological carnivores; thin dotted (green) curves are omnivores; light (blue) solid curve represents the frugivore Po. flavus; thick dashed dark curve represents the herbivore A. fulgens. The extinct musteloid Leptarctus primus is represented by the thick dark solid curve. B, comparison between extant T. taxus (darker-shaded red curve) and extinct L. primus (thick black curve) shows the similarity in SE patterns and higher ME values in T. taxus across the tooth row. C, the comparison between L. primus (solid black curve) and a modified L. primus model (dotted curve; as a proxy for the likely conspecific Hypsoparia bozemanensis) with deeper zygomae indicates that although adjusted strain energy values are similar, the model with deep zygomae exhibits increased mechanical efficiency at every tooth locus compared with the original L. primus model. Error bars represent 95% confidence intervals within species for which multiple resolution FE models were available.
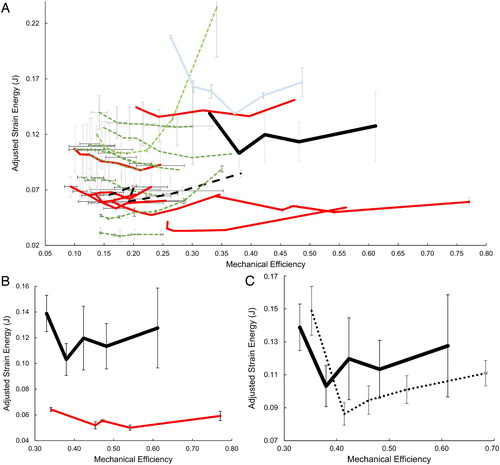
FIGURE 4. von Mises stress distributions in crania of extinct Leptarctus primus and extant Taxidea taxus, Potos flavus, Lycaon pictus, and Gulo gulo. Unilateral bites are shown for the right upper tooth row, with C (canine), P2 (second premolar), P3 (third premolar), P4 (fourth premolar), and M1 (first molar). Cooler (darker) shades indicate lower stress; warmer (lighter) shades indicate higher stress.
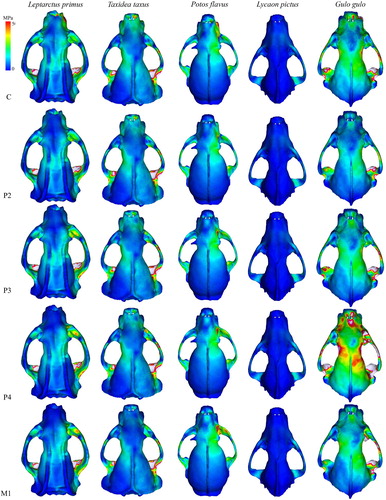
FIGURE 5. Hierarchical and resampling cluster analysis. Dendrogram based on ME and SE values using the centroid cluster method shows a highly supported cluster of L. primus clustering with Ly. pictus and Po. flavus. Node values indicate approximately unbiased (AU) bootstrap probability. For dendrograms of analyses employing other cluster methods and their bootstrap support, see Figure S1. Superscripted asterisks indicate fossil species. Abbreviation: U., Urocyon.
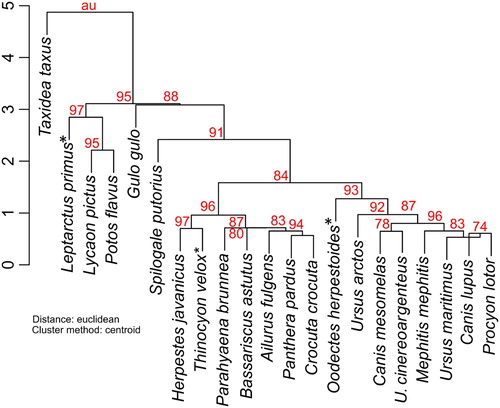
TABLE 1. Results of k-means analyses.
TABLE 2. Results of multivariate Blomberg’s K statistic for testing phylogenetic signal.
TABLE 3. Results of Mantel tests for phylogenetic covariation of biomechanical simulation data.
FIGURE 6. Bivariate plot of the first two principal components in the phylogenetic principal components analysis using uniform branch length configuration. 1, Ca. lupus; 2, L. primus; 3, G. gulo; 4, S. putorius; 5, T. taxus; 6, H. javanicus; 7, M. mephitis; 8, O. herpestoides; 9, Pa. pardus; 10, P. lotor; 11, Th. velox; 12, A. fulgens; 13, C. crocuta; 14, Ly. pictus; 15, Ur. maritimus; 16, Ur. arctos; 17, Ca. mesomelas; 18, Pr. brunnea; 19, B. astutus; 20, U. cinereoargenteus; 21, Po. flavus.