
Figures & data
FIGURE 1. Location and stratigraphy of McEachern’s Deathtrap Cave. A, map showing the location of MDC and other key fossil sites discussed in this study. B, depth-age plot. Ages are given in calibrated thousands of years ago (cal ka). C, longitudinal cross-section of MDC (modified from Kos, Citation2001). D, stratigraphy and associated ages of MDC. Ages are given in thousands of years ago (ka).
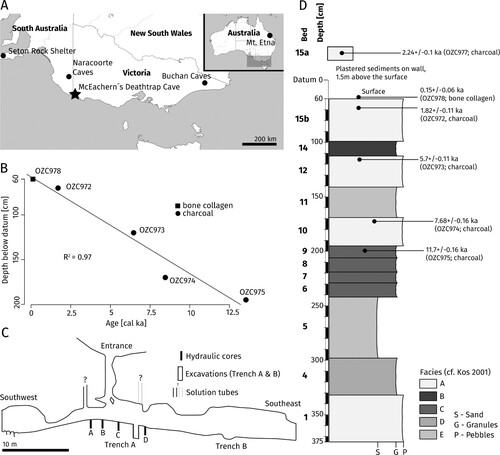
FIGURE 4. Results of the correspondence analyses excluding Amphibolurinae using the number of identified specimens, NISP, A, and minimum number of individuals, MNI, B, as symmetric maps (rows and columns as principal coordinates). Points (rows) represent different taxa, and triangles (columns) represent different sedimentary beds. Sizes of the symbols correspond to relative frequencies, while the color intensity of the symbols is proportional to their absolute contribution to the planar display. Ages of the sedimentary beds are given in calibrated thousands of years ago (cal ka).
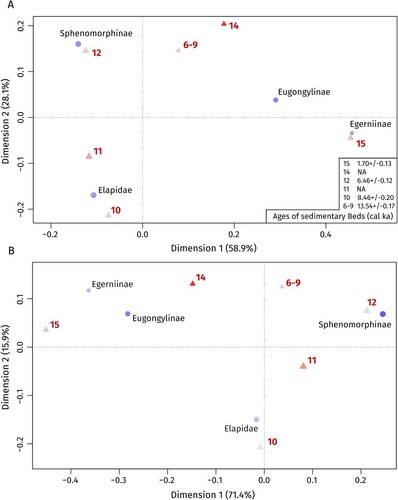
TABLE 1. Character matrix of the morphotypes identified in the deposit.
FIGURE 2. Different morphotypes of the Egerniinae and Eugongylinae subfamilies. Scale bars equal 2.5 mm. A, right maxilla of Tiliqua nigrolutea (NMV P254415) in medial view. B, left dentary of Liopholis sp. morph 1 (NMV P254587). C, right dentary of Liopholis sp. morph 2 (NMV P256193). D, right dentary of Eugongylinae indet. morph 1 (NMV P256348). E, left dentary of Eugongylinae indet. morph 2 (NMV P254639). F, right dentary of Eugongylinae indet. morph 3 (NMV P256359). G, right dentary of Eugongylinae indet. morph 4 (NMV P256336). H, left dentary of Eugongylinae indet. morph 5 (NMV P254379). B–H, lingual, labial and occlusal views (from top to bottom). Abbreviations: a, angle formed by the intersection of the posterior margins of the dorsal and angular processes; ami, anterior-most inflection between the coronoid process and the angular process; ap, angular process; cf, coronoid facet; cp, coronoid process; ds, dental sulcus; iaf, inferior alveolar foramen; mf, mental foramina; sn, splenial notch; sp, surangular process; sym, symphysis.
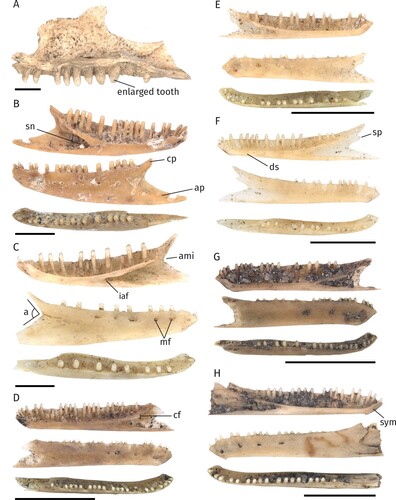
FIGURE 3. Different morphotypes of the Sphenomorphinae and Amphibolurinae subfamilies. Scale bars equal 2.5 mm. A, right dentary of Sphenomorphinae indet. morph 1 (NMV P 254385). B, right dentary of Sphenomorphinae indet. morph 2 (NMV P254452). C, right dentary of Sphenomorphinae indet. morph 3 (NMV P254381). D, left dentary of Sphenomorphinae indet. morph 4 (NMV P254491). E, left maxilla of Amphibolurinae indet. morph 1 (NMV P254682), medial (left) and lateral (right) aspects. A–D, lingual, labial and occlusal views (from top to bottom). Abbreviations: a, angle formed by the intersection of the posterior margins of the dorsal and angular processes; am, anterior margin of the maxilla; ami, anterior-most inflection between the coronoid process and the angular process; ap, angular process; at, acrodont teeth; cf, coronoid facet; cp, coronoid process; lmf, labial maxillary foramina; mg, Meckelian groove; mf, mental foramina; mp, maxillary process; nr, naris ridge; pt, pleurodont teeth; sp, surangular process; ss, subdental shelf.
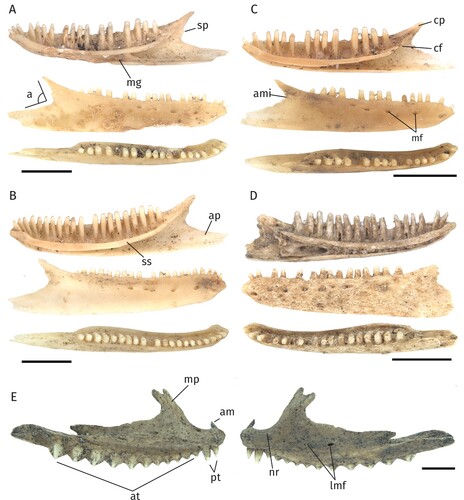
TABLE 2. Abundances of taxa in the different sedimentary beds based on the minimum number of individuals (MNI) and number of identified specimens (NISP). Ages of the sedimentary beds are given in calibrated thousands of years ago (cal ka).
FIGURE 5. A, relative abundances of order, and B, subfamily level of identification based on the minimum number of individuals (MNI) in the different sedimentary beds.
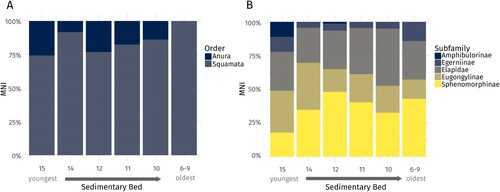
FIGURE 6. A, LOESS (local regression) fits of temperature (red) and aridity (blue) showing predicted values for the ages of the different sedimentary beds (triangles). Optimal smoothing parameters based on generalized cross-validation: α = 0.72 (temperature), α = 0.61 (% C4 grasses). B, correlations (linear models) of the different dimensions of the subfamily-level correspondence analyses and relative abundances of taxa (% of the minimum number of individuals belonging to a respective subfamily in the different sedimentary beds) with temperature and aridity. Darker shaded graphs indicate significance of linear models (p < 0.05). Shaded areas represent 0.95 level confidence intervals.
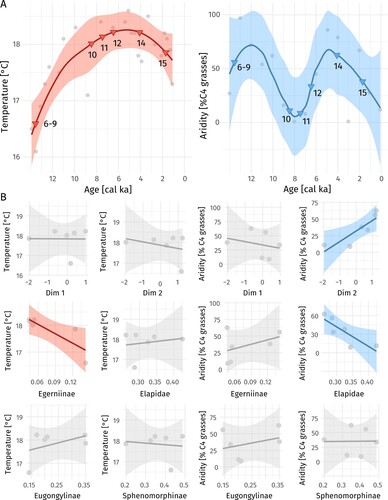
TABLE 3. Comparison of lizard taxa between the MDC deposit and contemporary habitat surrounding the cave (Robertson and Coventry Citation2019; ALA Citation2020).