Figures & data
FIGURE 1. Absolute and relative orbit size in different archosauromorph groups. A, schematic illustration of obtained measurements. B, boxplots showing orbit lengths, and C, relative orbit sizes for different groups. ‘+’ and numerical values indicate mean value.
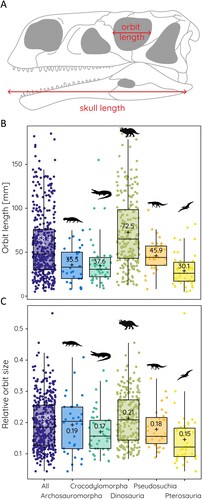
FIGURE 2. Scatterplots of orbit size against skull length for: A, all sampled species; B, non-archosaurian archosauromorphs; C, crocodylomorphs; D, dinosaurs; E, pseudosuchians; and F, pterosaurs. Equation from phylogenetic generalized least square regression, r- and R2-values, and sample size given for each.
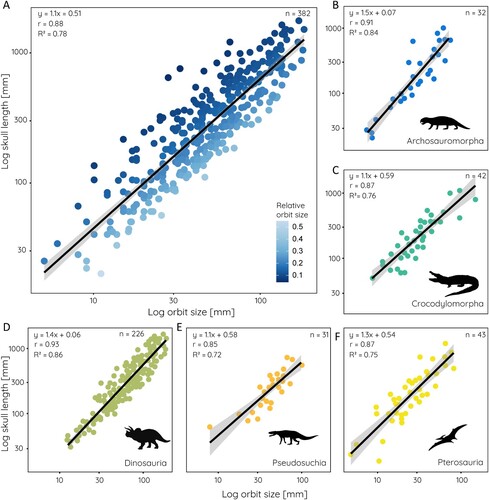
FIGURE 3. Relative orbit size in different dinosaur groups. Scatterplots of orbit size against skull length for: A, basal Ornithischia; B, Thyreophora; C, Marginocephalia; D, Ornithopoda; E, Sauropodomorpha; F, Sauropoda; G, Theropoda; H, Maniraptoriformes; and I, Paraves. Equation from least square regression, r- and R2-values, and sample size given for each.
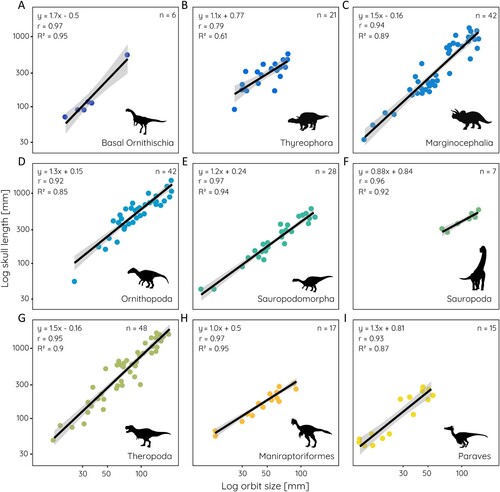
FIGURE 4. Residual values indicating orbit sizes above and below regression results (positive values indicating orbit sizes higher than predicted for given skull size, negative values indicated smaller orbit sizes than predicted). Comparisons shown between A, major archosauromorph groups; and B, major dinosaur groups. Red dotted line indicates regression value.
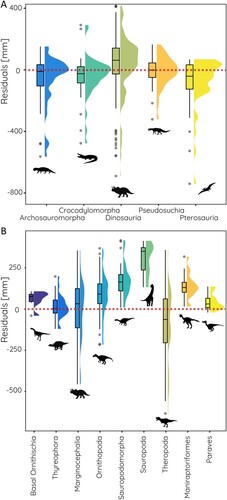
FIGURE 5. Orbit size, skull size, and relative orbit size through time and for different dietary categories. Scatterplots of orbit size against skull length in the: A, Triassic; B, Jurassic; and C, Cretaceous. Boxplots comparing: D, orbit size; E, skull length; and F, relative orbit size during the Mesozoic; and G–I, for different dietary categories. Equation from least square regression, r- and R2-values, and sample size given in A–C, statistical significance (p < 0.05) in D–I indicated by *.
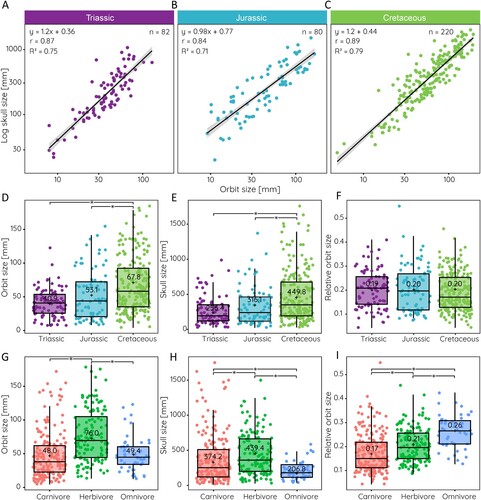
FIGURE 6. Relative orbit size in phylogenetic context. A, Relative orbit size mapped onto archosauromorph supertree, compared B against time, and frequency distribution shown for C, major archosauromorph and D, dinosaur groups. Abbreviations: Arch., Archosauria; Croc., Crocodylomorpha; Dino., Dinosauria; Mani., Maniraptoriformes; Margi., Marginocephalia; Orni., Basal Ornithischia; Ornipo., Ornithopoda; Par., Paraves; Pseudo., Pseudosuchia; Ptero., Pterosauria; Sauro., Sauropoda; Sauromo., Sauropodomorpha; Ther., Theropoda; Thyr., Thyreophora.
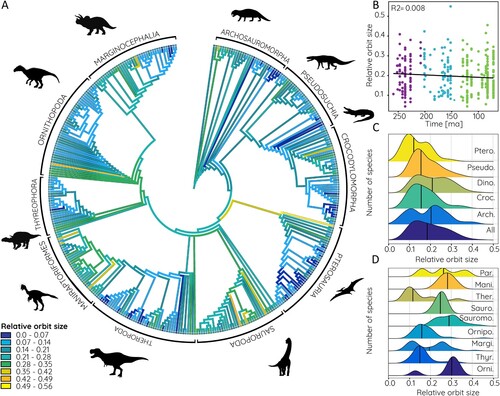
FIGURE 7. Estimated eye size based on data from modern birds in phylogenetic context. A, Relative orbit size mapped onto archosauromorph supertree, B, compared against time, and frequency distribution shown for C, major archosauromorph and D, dinosaur groups. Abbreviations: Arch., Archosauria; Croc., Crocodylomorpha; Dino., Dinosauria; Mani., Maniraptoriformes; Margi., Marginocephalia; Orni., Basal Ornithischia; Ornipo., Ornithopoda; Par., Paraves, Pseudo., Pseudosuchia; Ptero., Pterosauria; Sauro., Sauropoda; Sauromo., Sauropodomorpha; Ther., Theropoda; Thyr., Thyreophora.
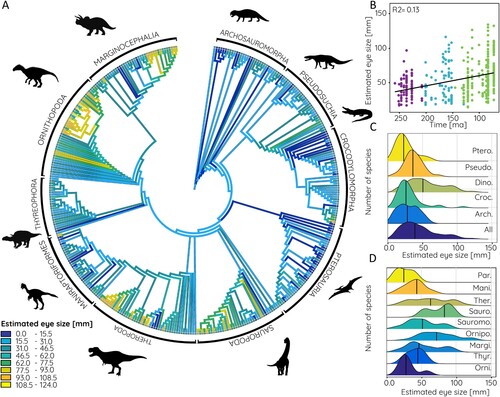
FIGURE 8. Estimated eye size based on data from modern crocodilians in phylogenetic context. A, Relative orbit size mapped onto archosauromorph supertree, B, compared against time, and frequency distribution shown for C, major archosauromorph and D, dinosaur groups. Abbreviations: Arch., Archosauria; Croc., Crocodylomorpha; Dino., Dinosauria; Mani., Maniraptoriformes; Margi., Marginocephalia; Orni., Basal Ornithischia; Ornipo., Ornithopoda; Par., Paraves; Pseudo., Pseudosuchia; Ptero., Pterosauria; Sauro., Sauropoda; Sauromo., Sauropodomorpha; Ther., Theropoda; Thyr., Thyreophora.
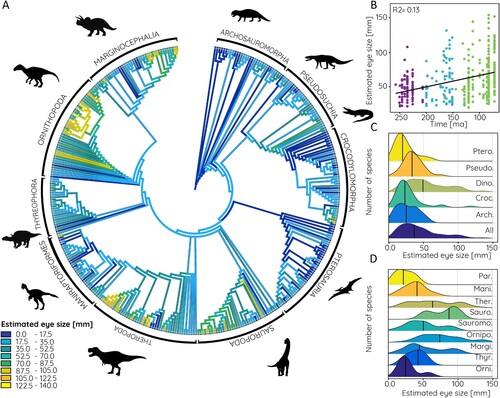
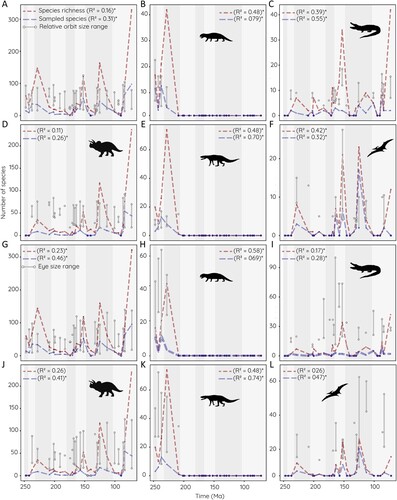
FIGURE 9. Relative orbit size and estimated eye size compared with species richness. A–F, relative orbit size, and G–L, estimated eye size (averaged from data based on modern birds and crocodilians) plotted against face-value (= raw, uncorrected) species richness and sample size for individual stages of the Mesozoic. A, G, all archosauromorph species; B, H, non-archosaurian archosauromorphs; C, I, crocodylomorphs; D, J, dinosaurs; E, K, pseudosuchians; and F, L, pterosaurs. Correlation coefficient and statistical support (p < 0.05 indicated by *) given for each correlation.