Figures & data
Table 1. Parameters of cigarette samples.
Figure 1. Number concentration of MCS particles from three brands of cigarette. (a) Measured by SCS-DMS. (b) Measured by SM-ELPI.
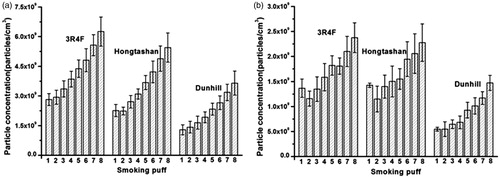
Figure 2. Size distribution of smoke particles of the third puff of a 3R4F cigarette. (a) Measured by SCS-DMS. (b) Measured by SM-ELPI.
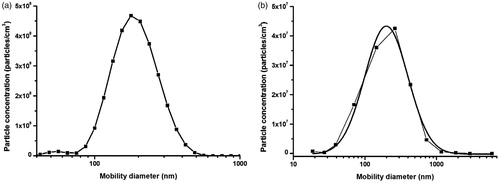
Figure 3. CMDm of MCS particles from 3 brands of cigarette. (a) Measured by SCS-DMS. (b) Measured by SM-ELPI.
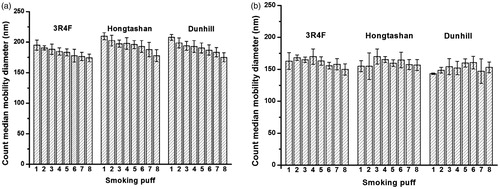
Figure 4. Mass of TPM collected on 12 aluminum foils.
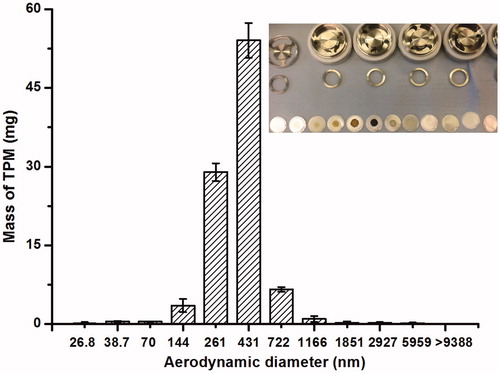
Figure 5. Distribution of nicotine in MCS particles of different sizes determined by SM-ELPI and SCS-ELPI.
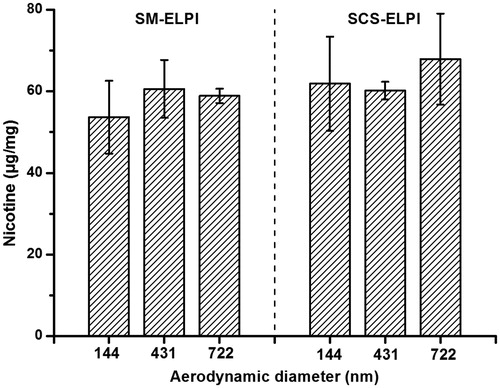
Figure 6. Distribution of solanesol in MCS particles of different sizes determined by SM-ELPI and SCS-ELPI.
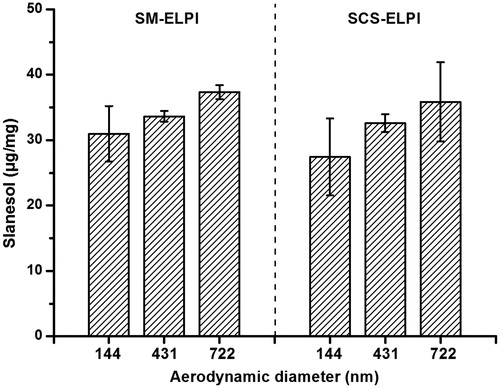
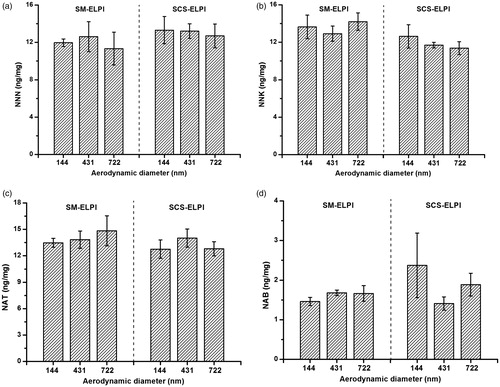
Figure 7. Distribution of TSNAs in MCS particles of different sizes determined by SM-ELPI and SCS-ELPI. (a) NNN; (b) NNK; (c) NAT; (d) NAB.