
Figures & data
Figure 1. Schematic of a simplified case, in which the displacement vector between the and
spheres and the magnetic dipole moments of both spheres align — an upper bound for the magnitude of the magnetic force.
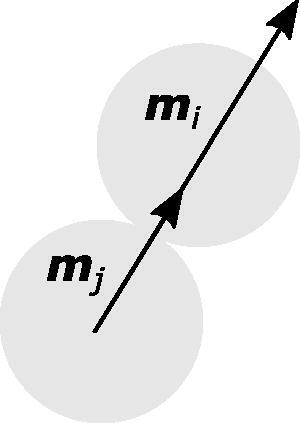
Figure 2. Hall flow times for 50 g of powder. The powder did not flow through the Hall funnel without drying for the size fraction Error bars in the y axes are the standard deviation of the repeated measurements; error bars in the x axis are the range of particle sizes in each fraction.
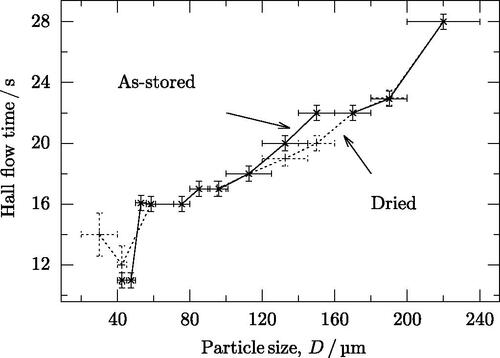
Figure 3. Angle of repose results in the as-stored (non-dried) condition. Angles of repose could not be measured for particles larger than the data shown here, as the powder did not form a pile. Error bars in the y axes are the standard deviation of the repeated measurements; error bars in the x axis are the range of particle sizes in each fraction.
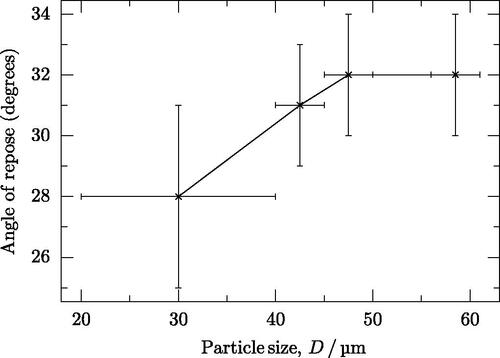
Figure 4. Two metrics from shear test data that represent the resistance to flow under various stress states. Larger values imply more resistance to flow. (a) Cohesion, the stress required to cause flow under pure shear (with no applied compressive stress). (b) Unconfined yield stress, the onset of flow under a pure normal stress.
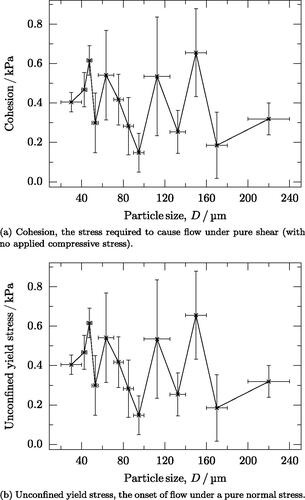
Figure 5. Optical micrographs of the powder studied. (a) (b)
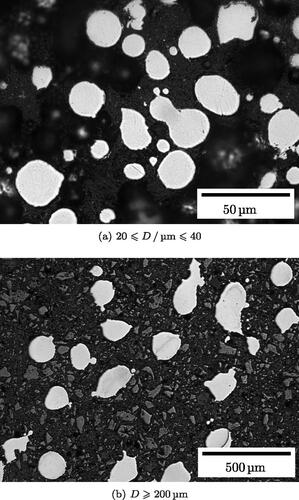
Figure 6. Optical microscopy and static image analysis of particle fractions. Error bars in the y axes are the standard deviation of the data for the particles sampled and those in the x axis are the ranges of the particle size fraction, except the fraction over 200 µm, which is assumed to be 20 µm. (a) Stereologically corrected mean particle size in each measured fraction. (b) Particle circularity in each measured fraction.
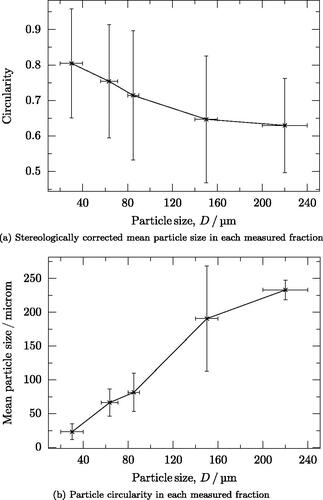
Figure 7. Magnetization hysteresis curve for powder with particles in the size range The inset shows an enlarged versions of the curve about zero applied field. The dashed lines indicate zero applied field and the remanent magnetization in the powder sample.
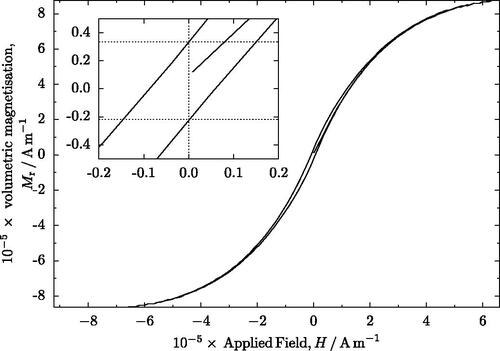
Figure 8. Volumetric magnetization in the powder fractions. Error bars in the y axes are the standard deviation of the measurements in the positive and negative branches of the hysteresis loop; error bars in the x axis are the range of particle sizes in each fraction. (a) Remanence. (b) Saturation.
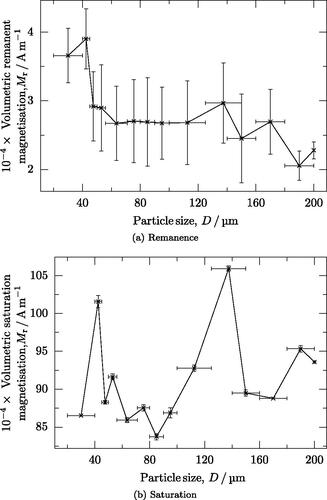
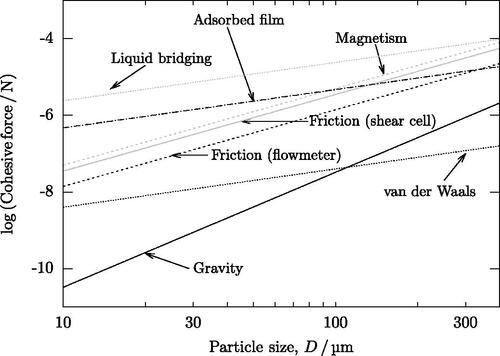
Figure 9. Magnitude of forces that could act on particles during flow in a flowmeter or in a shear cell, based on the equations outlined in this article.
Data availability statement
All data used in this article are available from a permanent online repository (Hulme-Smith, Citation2021).