
Figures & data
Figure 1. PRISMA 2009 flow diagram. Adapted from: Moher, Liberati, Tetzlaff, and Altman (Citation2009)
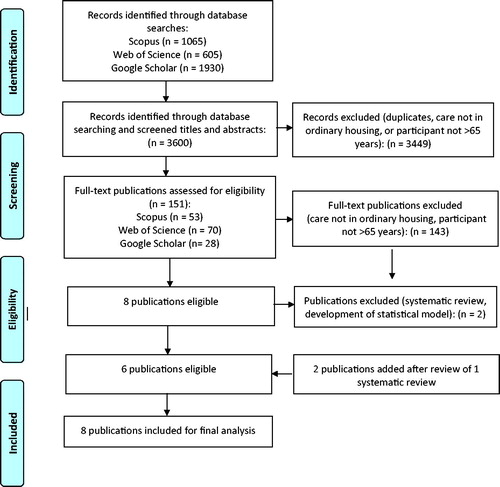
Table 1. Characteristics of the publications included in the scoping review (n = 8).
Table 2. An overview of enablers and barriers presented in the publications included in the scoping review (n = 8).
