
Figures & data
Figure 1. Baseline (year 1) and follow-up (year 2–5) of participants stratified per year of recruitment (2011–2014). Response rate summarized column-wise per year of participation (years 1–5) and presented as % (number of participating athletes/number of eligible athletes).
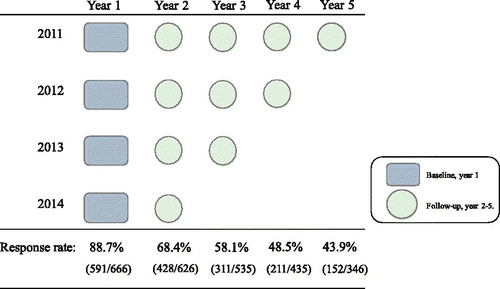
Table 1. Basic characteristics at baseline (year 1) of the total study population, and comparison of athletes with and without physician-diagnosed asthma (asthma vs. PAR).
Table 2. Basic characteristics of the population at risk at baseline (year 1) comparing incident cases of physician-diagnosed asthma (incident asthma) and subjects who remained without asthma diagnosis (no asthma) during follow-up.
Table 3. Risk factors at baseline for incident physician-diagnosed asthma, analyzed in bivariate and multivariate logistic regression models.
Table 4. Comparing athletes who completed follow-up and athletes who were lost to follow-up in the population at risk at baseline (year 1).