
Figures & data
Figure 1. Study design. At 1 week before ESS (Visit 1), ACQ score, lung function test, FeNO, blood sampling and total serum IgE were measured in 28 patients. Three patients were excluded. At 8 weeks after ESS (Visit 2) and 52 weeks after ESS (Visit 3), ACQ score, lung function test, FeNO and blood sampling were measured in the included 25 patients.
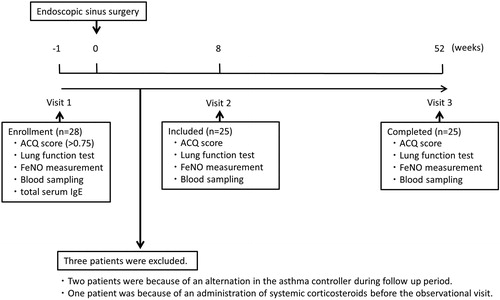
Table 1. Characteristics of baseline and 1-year after sinus surgery.
Figure 2. A–C: The short/long-term mean (standard deviation) changes in ACQ, blood eosinophil counts and FeNO from 1-week before endoscopic sinus surgery. Ten subjects (40%) were in the improved group, while 60% (n = 15) of the patients were in the unimproved group. The ACQ score temporally improved in the short-term even in the ACQ score unimproved group. Transitions in type 2 inflammation biomarkers from 8 weeks to 52 weeks after ESS were concordant with those in the ACQ score in the unimproved group.
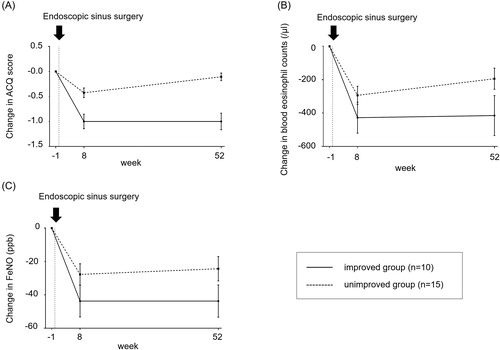
Figure 3. A–D: Correlations between change in ACQ score and blood eosinophil counts and FeNO. The spearman correlation analysis was performed. Change in ACQ at 52 weeks after ESS positively correlated with changes in the blood eosinophil counts and FeNO.
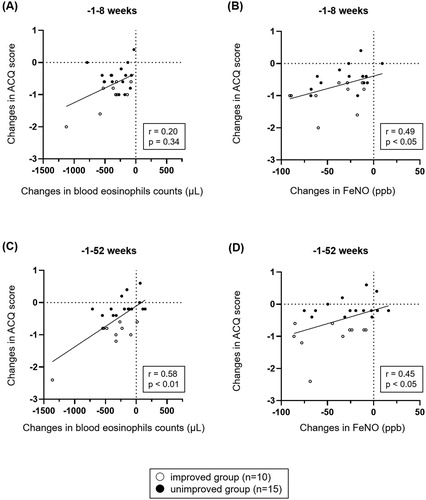
Figure 4. A and B: Changes in ACQ score from baseline to 8 weeks (A) and from baseline to 52 weeks (B) in subjects with baseline total IgE <601 IU/mL and ≥601 IU/mL after ESS. The data are presented as median (interquartile range). For the comparison, Mann-Whitney U-test was used. ACQ score in subjects with baseline total IgE ≥ 601 IU/mL were more improved than those with baseline total IgE < 601 IU/mL.
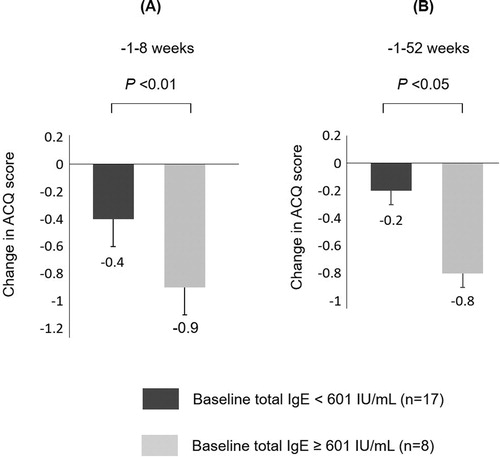
Table 2. A comparison of characteristics of subjects with and without improvement in asthma control.