
Figures & data
Table A1. List of 15 factors for social vulnerability index
Figure 1. Hospital resource utilization of pediatric patients with asthma admitted to Driscoll Children’s hospital during 2010–2016.
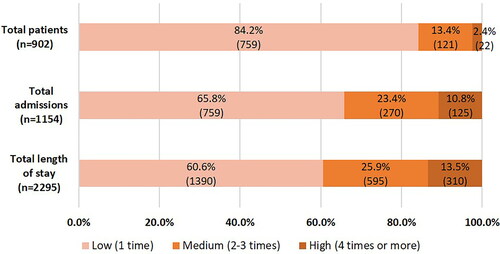
Table 1. Comparison of hospital resource utilization among low, medium, and high groups in pediatric asthma hospitalizations.
Table A2. Pearson correlation coefficients between ambient air pollutants and social vulnerability index.
Table 2. Comparison of patient and environmental characteristics among hospital utilization groups.
Table 3. Results of bivariate and multivariate ordered logistic regression analysis among hospital utilization groups.
Table A3. Results of multivariate ordered logistic regression analysis for each pollutant.