
Figures & data
Table 1. Study design of the three clinical studies.
Table 2. Country specific unit costs (2019, conversion to British pound sterling (GBP)).
Table 3. Average resource use per patient per year by treatment option in each study.
Figure 1. Average total direct costs by treatment option in each study in (a) Indonesia, (b) Thailand and (c) Vietnam.
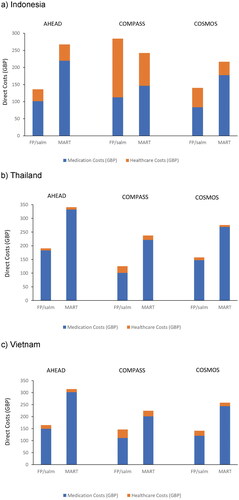
Figure 2. Average total direct costs by treatment option across all studies in Indonesia, Thailand and Vietnam.
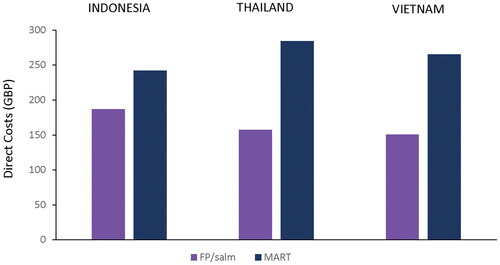
Table 4. Average total direct costs by treatment option in each study by country.
Availability of data and materials
Information on GSK’s data sharing commitments and requesting access can be found at: https://www.clinicalstudydatarequest.com.