
Figures & data
Table 1. Descriptive data on demographics and doctor diagnosed allergies (N = 270).
Table 2. Descriptive data on FeNO, stratified by gender, family education and allergy.
Table 3. Proportion of students with low, intermediate and high FeNO levels (N = 270).
Table 4. Descriptive data on home environment and outdoor air pollution for the students (N = 270).
Table 5. Associations between FeNO and reported health (N = 270).
Figure 1. Associations between FeNO, home environment and outdoor PM10 in a mutually adjusted model (N = 270). Analyzed by two level (student, school) linear mixed models, adjusting for gender and family education level (all exposure variable with p < 0.1 in included in the model)
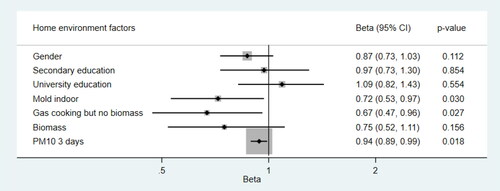
Table 6. Associations between FeNO, home environment and outdoor air pollution (N = 270).