
Figures & data
Figure 1. The flow chart of article selection.
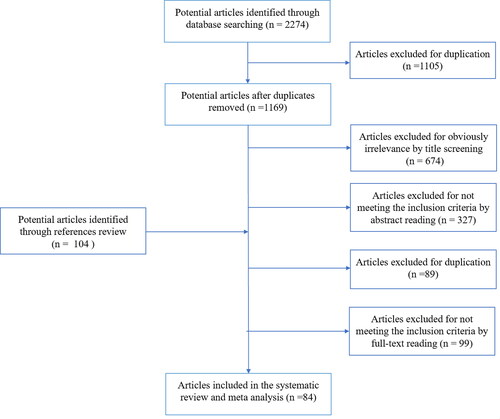
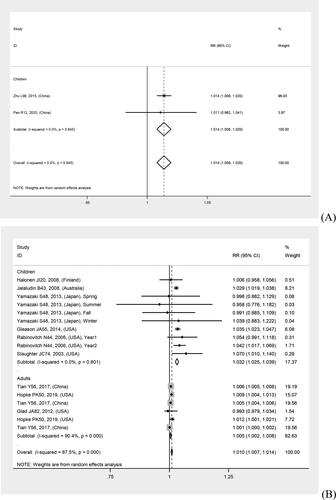

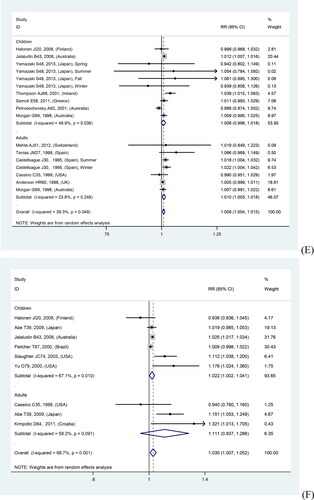
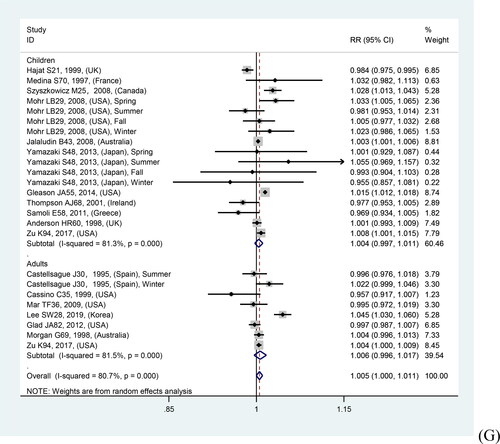
Table 1. Relationships between air pollutants and asthma exacerbations in overall and quality sensitivity analyses.

Supplemental material
Figure_S4._Begg_s_funnel_plot_for_relationships_between_air_pollutants_and_asthma_exacerbations_in_quality_sensitivity_analyses.pdf
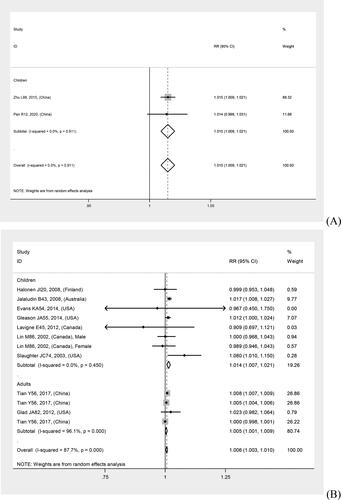
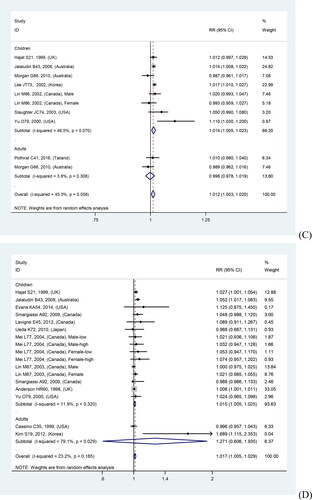
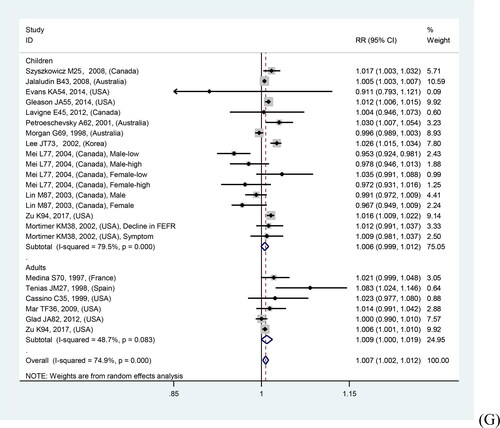
Download PDF (78.5 KB)Figure_S3._Forest_plot_for_relationships_between_air_pollutants_and_asthma_exacerbations_in_quality_sensitivity_analyses.pdf
Download PDF (87.4 KB)Figure_S2._Begg_s_funnel_plot_for_relationships_between_air_pollutants_and_asthma_exacerbations_in_overall_analyses.pdf
Download PDF (89.7 KB)Figure_S1._Forest_plot_for_relationships_between_air_pollutants_and_asthma_exacerbations_in_overall_and_various_outcomes_analyses.pdf
Download PDF (144.8 KB)Table_S3._Relationships_between_air_pollutants_and_asthma_exacerbations_in__various_outcomes_and_age_subgroup_analyses.pdf
Download PDF (139.4 KB)Table_S2.__The_quality_scores_and_the_main_characteristics_of_the_eligible_studies.xlsx
Download MS Excel (24.4 KB)Table_S1._Search_strategies.pdf
Download PDF (256.4 KB)Data availability
Data are available on reasonable request (contact Yan Hu, [email protected]).