
Figures & data
Table 1. Patient characteristics overall and by sex, race, and ethnicity.
Figure 1. (A) Biologic recipient at enrollment and (B) insurance status by sex, race/ethnicity, and age. PCP, primary care provider.
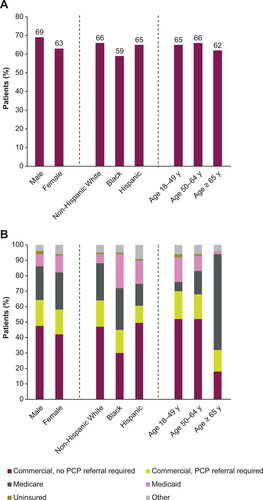
Figure 2. Median FEV1 (A) and FVC (B) percent predicted by sex, race/ethnicity, and age. Error bars denote interquartile range. FEV1, forced expiratory volume in 1 s; FVC, forced vital capacity.
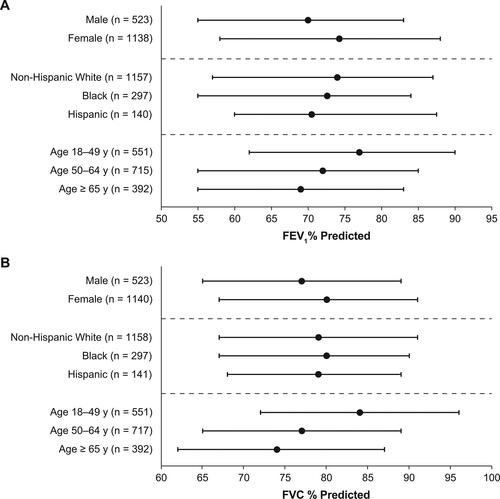
Figure 3. Highest median BECa by sex, race/ethnicity, and age. aHighest BEC while not receiving biologics or SCS. Error bars denote interquartile range. BEC, blood eosinophil count; SCS, systemic corticosteroids.
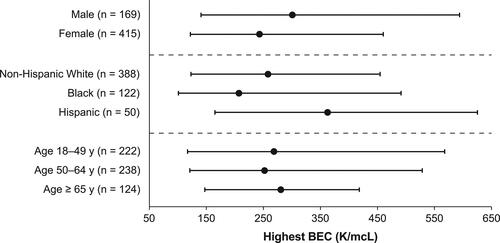
Figure 4. Rates of HCP-confirmed asthma (A) exacerbations, (B) emergency department visits, and (C) hospitalizations by sex, race/ethnicity, and age. *P < 0.05; Error bars denote 95% CI. CI, confidence interval; HCP, health care provider.
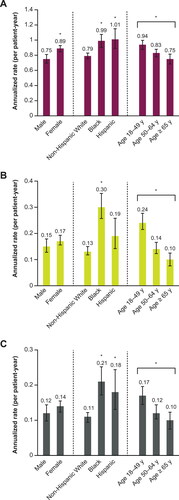
Figure 5. Mean (A) ACT and (B) SGRQ scores by sex, race/ethnicity, and age. *P < 0.05; Error bars denote standard deviation. ACT scores range from 5 to 25 with higher scores reflecting better asthma control. SGRQ scores range from 1 to 100, with higher scores indicating poorer HRQoL. ACT, Asthma Control Test; HRQoL, health-related quality of life; SGRQ, St. George’s Respiratory Questionnaire.
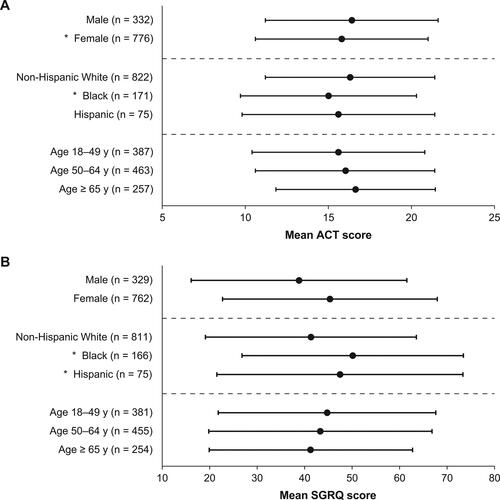
Table 2. Patient and clinical characteristics by age at enrollment and age at diagnosis.
SA_Disease_Burden_in_the_US_Supplemental_8Nov2021.docx
Download MS Word (31.5 KB)Data availability statement
CHRONICLE is an ongoing study; individual de-identified participant data cannot be shared until the study concludes. The full study protocol is available upon request of the corresponding author. Individuals who were or were not involved in the study may submit publication proposals to the study’s Publication Steering Committee by contacting the corresponding author.