Figures & data
Figure 1. Trial participants by disease severity and weight category
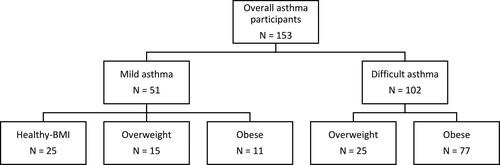
Table 1. Demographic and clinical characteristics overall and stratified by disease severity.
Table 2. Comparison of all patients divided into BMI tertiles.
Table 3. Comparison of difficult-to-control asthma patients divided into BMI tertiles.
Figure 2. (A) BMI for all patients categorised by T2-status. (B) BMI for difficult-to-control patients categorised by T2-status. (C) FeNO for all patients by BMI tertile. (D) FeNO for difficult-to-control patients by BMI tertile. (E) Eosinophils for all patients by BMI tertile. (F) Eosinophils for difficult-to-control patients by BMI tertile.
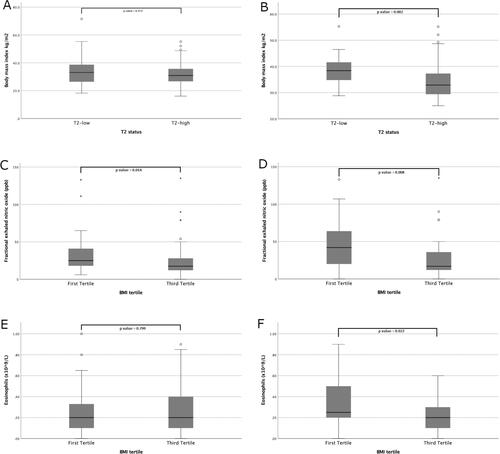
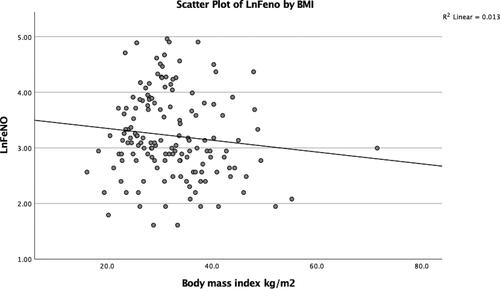
Figure 3. Negative correlation between log-transformed FeNO and BMI.