
Figures & data
Table 1. Baseline characteristics of groups.
Figure 1. Time spent in activity thresholds. Bar chart showing mean and 95% confidence intervals for inactive time, light and moderate-vigorous physical activity across the three groups. Annotations display p values between groups when Tukey’s multiple comparisons tests are performed.
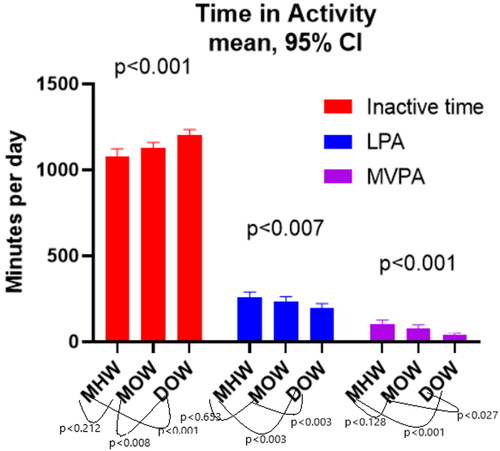
Figure 2. Average acceleration and intensity gradient results. Bar charts showing a) average acceleration and b) intensity gradient across the three groups. Annotations display p values between groups when multiple comparisons testing is performed using Dunn’s multiple comparison tests.
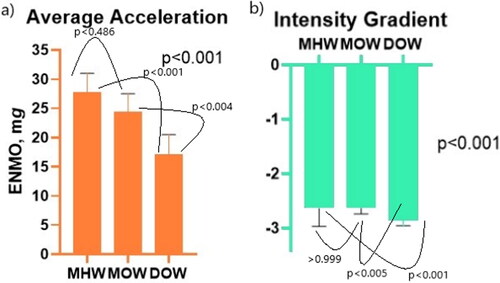
Table 2. Accelerometer results.
Table 3. Correlations of PA parameters and relevant asthma measures.
Table 4. Comparison of highest and lowest quartiles based on average acceleration.
Table 5. Simple linear regression results.
Table 6. Multiple linear regression results. ACQ and AQLQ as dependent variables with PA parameter plus BMI, age and gender as independent variables.