
Figures & data
Figure 1. Flow chart over inclusion of patients. Randomly included patients without overlap between cohorts.
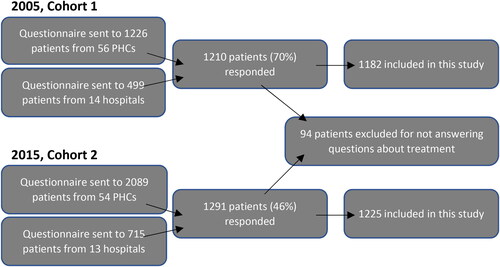
Table 1. Characteristics of the study participants in 2005 and 2015 (n (%)).
Table 2. Pharmacological asthma treatment in 2005 compared to 2015 (n (%)).
Figure 2. Prevalence (%) of treatment on step 1–3 within each age group (years (n)) in 2015.
Step 1a: No maintenance treatment. Step 1b: Periodic treatment with inhaled corticosteroids.
Step 2: Regular treatment with inhaled corticosteroids only. Step 3: Regular treatment with inhaled corticosteroids in combination with LABA and/or montelukast.
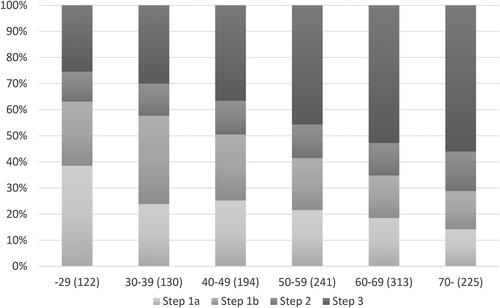
Table 3. Asthma treatment 2015 in patients on different treatment steps.
Figure 3. Prevalence (%) of daily use of SABA within each treatment step (n) in 2015.
Step 1a: No maintenance treatment. Step 1b: Periodic treatment with inhaled corticosteroids.
Step 2: Regular treatment with inhaled corticosteroids only. Step 3: Regular treatment with inhaled corticosteroids in combination with LABA and/or montelukast.
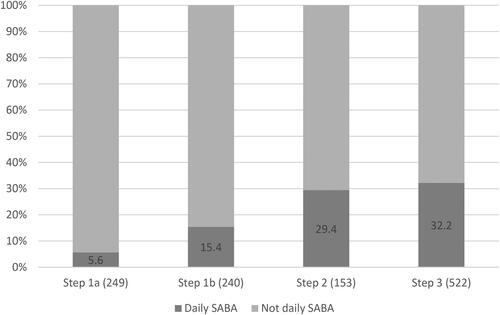
Table 4. Daily SABA use in 2015 (n (%), p value within group for chi2 test) and adjusted odds ratio (OR (95% CI))*.