Figures & data
Table 1. The specific primers used for qRT-PCR.
Figure 1. The protein expression of Notch1-GATA3 pathway during acute PM2.5 exposure (n = 3). (A, B and C) The normalized protein levels of Nothc1-GATA3 pathway in D-HBE-As cells treated with different concentrations of PM2.5 (50, 100, 200 μg/ml) for different hours (0, 6, 12, 24, 48 h) to mimic acute exposure. (D, E and F) The Western Blot results of Nothc1-GATA3 pathway in D-HBE-As cells during acute PM2.5 exposure. *p < 0.050, **p < 0.010, ***p < 0.000, compared with 0h group as control.
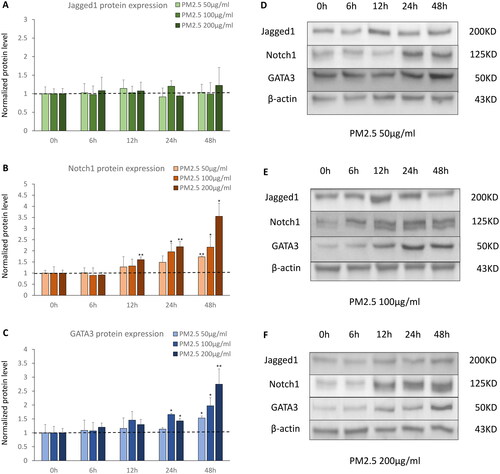
Figure 2. The mRNA expression of Notch1-GATA3 pathway and miR-139-5p during acute PM2.5 exposure (n = 4). *p < 0.050, **p < 0.010, ***p < 0.000, compared with 0h group as control.
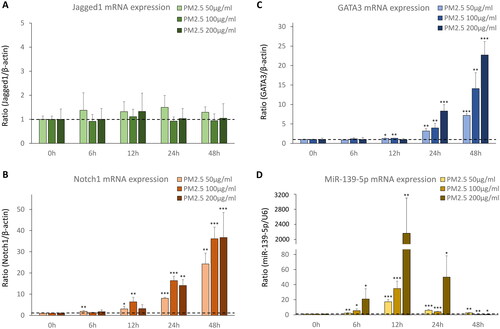
Figure 3. The mRNA expression of Notch1-GATA3 pathway and miR-139-5p in D-HBE-As cells transfected with miR-139-5p mimic, inhibitor, or scrambled controls (n = 4). *p < 0.050, **p < 0.010, ***p < 0.000, compared with control group.
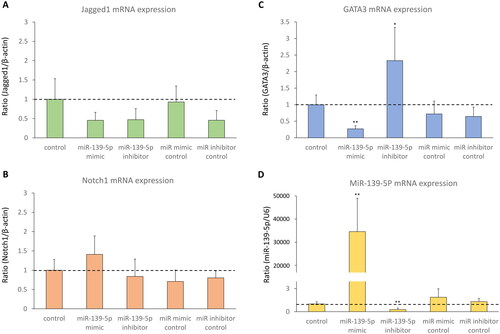
Figure 4. The protein expression of Notch1-GATA3 pathway in D-HBE-As cells transfected with miR-139-5p mimic, inhibitor, or scrambled controls (n = 3). (A, B and C) The normalized protein levels of Nothc1-GATA3 pathway. (D) The Western Blot results of Nothc1-GATA3 pathway. *p < 0.050, **p < 0.010, ***p < 0.000, compared with control group.
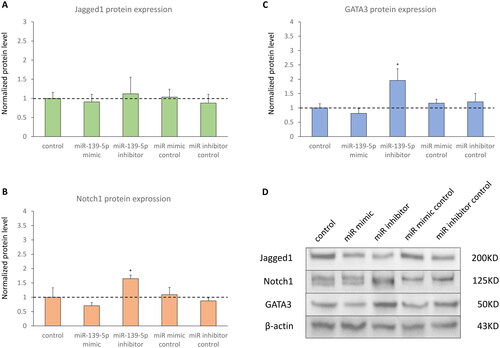
Figure 5. The mRNA expression of Notch1-GATA3 pathway and miR-139-5p during acute PM2.5 exposure in D-HBE-As cells transfected with miR-139-5p mimic, inhibitor, or scrambled controls (n = 4). *p < 0.050, **p < 0.010, ***p < 0.000, compared with only PM2.5 exposure group as control.
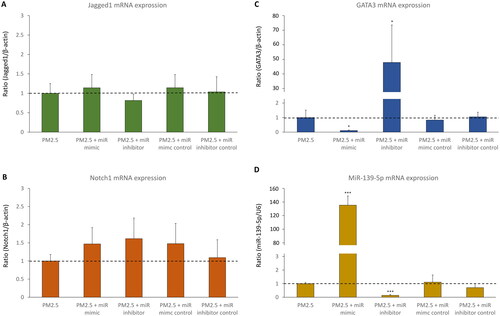
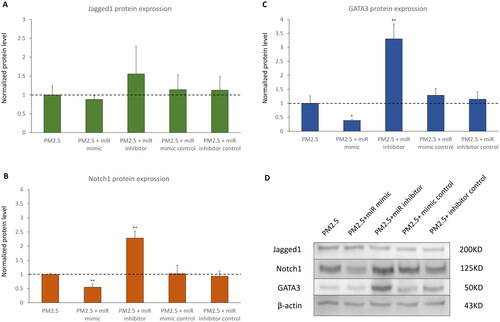
Figure 6. The protein expression of Notch1-GATA3 pathway during acute PM2.5 exposure in D-HBE-As cells transfected with miR-139-5p mimic, inhibitor, or scrambled controls (n = 3). (A, B and C) The normalized protein levels of Nothc1-GATA3 pathway. (D) The Western Blot results of Nothc1-GATA3 pathway. *p < 0.050, **p < 0.010, ***p < 0.000, compared with only PM2.5 exposure group as control.