Figures & data
Table 1. Participant characteristics (mean ± SD).
Figure 1. Summary of participant grouping and study protocol.
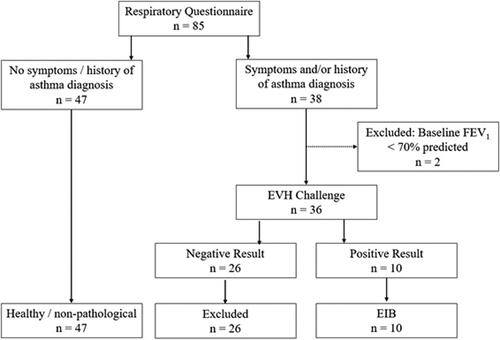
Figure 2. Illustration of the compartments related to each phase angle parameter. The blue and red areas show which sections of the thorax are involved in calculating each phase angle. The phase angle represents the synchrony between the two areas shown as described above.
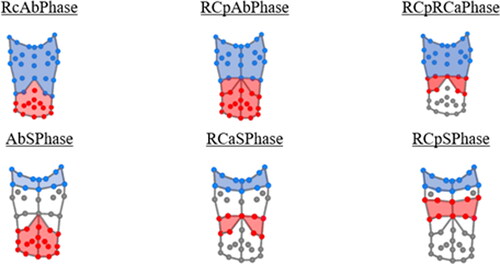
Table 2. Mean ± standard deviation spirometry data for the healthy group at rest and the EIB group across the EVH conditions.
Table 3. Exercise-induced bronchoconstriction (EIB) mean ± standard deviation (SD) and 95% confidence intervals (CI) for the basic respiratory and timing breathing parameters across each EVH challenge time points.
Table 4. Exercise-induced bronchoconstriction (EIB) mean ± standard deviation (SD) and 95% confidence intervals (CI) for the regional contribution breathing parameters across each condition for the phase angle breathing parameters across each condition.
Table 5. Comparison of the EIB group at rest, evoked, and during recovery to the healthy group at rest. * significant with p ≤ 0.05.
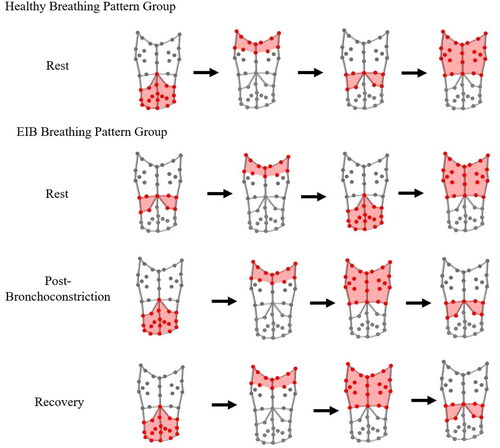
Figure 3. Illustration of the compartment movement order, from left to right, for the healthy asymptomatic breathing pattern group during rest, and exercise-induced bronchoconstriction breathing pattern group during rest, post-bronchoconstriction, and recovery post-exercise.