Figures & data
Table 1. Linear relationships between Daphnia acute or chronic toxicity data and fish chronic toxicity data.
Figure 1. Relationships between Daphnia 48 h LC50 (a) and Daphnia NOEC (b) and fish NOEC values with the geometric mean approach. The dashed lines represent the 95% confidence interval. Italics: name of the outliers.
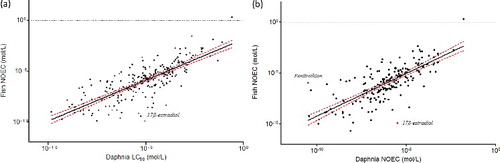
Figure 2. Relationships between Daphnia LC50 and fish NOEC values by MOA. Italics: name of the outliers; (a) all MOA; (b) MOA 1, r2 = 79; (c) MOA 3, r2 = 0.83.
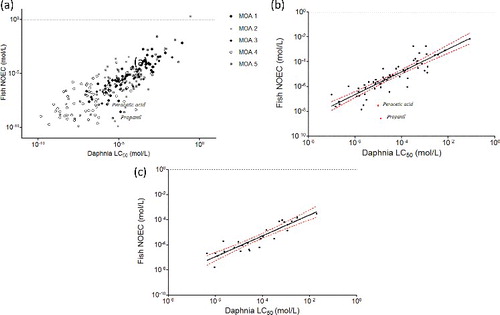
Figure 3. Relationships between Daphnia NOEC and fish NOEC values by MOA. Italics: name of the outliers; (a) all MOA; (b) MOA 1, r2 = 0.66; (c) MOA 3, r2 = 0.65.
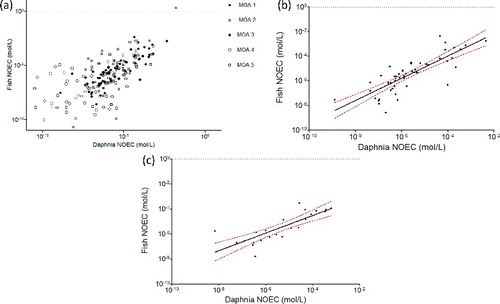
Figure 4. Sensitivity ratio derived with acute Daphnia data versus chronic fish data (black bar) and chronic Daphnia data versus chronic fish data (grey bar) in percentage of chemicals of the whole dataset; i.e. 34.7% of the chemicals demonstrate a higher chronic toxicity in Daphnia compared to NOEC fish and values range within a factor of 10; for 39% of the chemicals, the acute Daphnia LC50 indicates a lower sensitivity compared to chronic NOEC fish and values range within a factor of 10.
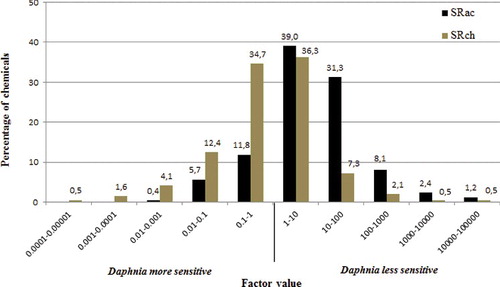
Table 2. Substances with a high interspecies sensitivity ratio (SRch).
Figure 5. Distribution of the chronic sensitivity ratios between Daphnia NOEC and fish NOEC according to their MOA.
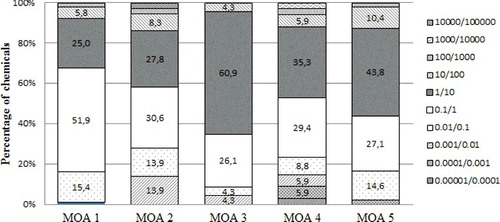
Table 3. Linear relationships between acute fish data and chronic fish data.
Figure 6. Relationships between fish 96 h LC50 and fish NOEC values with the geometric mean approach. The dashed lines represent the 95% confidence interval. Italics: name of the outliers.
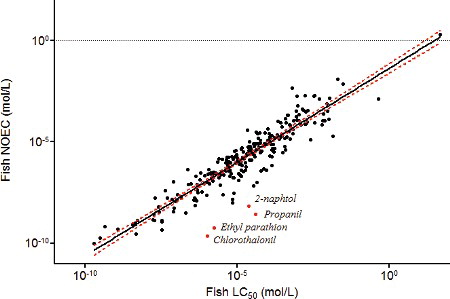
Figure 7. Relationship between fish 96 h LC50 and fish NOEC values by MOA. The dashed lines represent the 95% confidence interval; (a) all MOA; (b) MOA 3, r2 = 0.88; (c) MOA 5, r2 = 0.88.
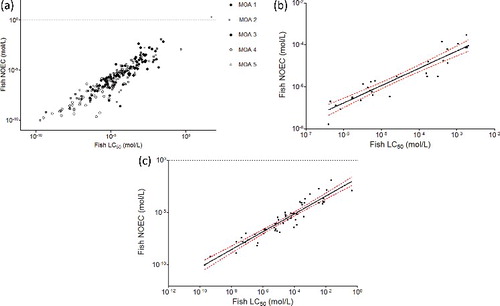
Table 4. Name and mode of action (MOA) of chemicals with Acute to Chronic Ratio (ACR) < 1.
Figure 8. Acute-to-chronic fish toxicity ratio distribution.
Table 5. Name and mode of action (MOA) of chemicals with acute-to-chronic ratio (ACR) >100.
Figure 9. Acute-to-chronic fish toxicity ratio distribution according to the MOA.