
Figures & data
TABLE 1 Characteristics of the process water from the thermomechanical pulp mill and the permeate after MF of the process water
FIGURE 1 Influence of pressure on flux during UF of process water (•) and MF permeate (o).
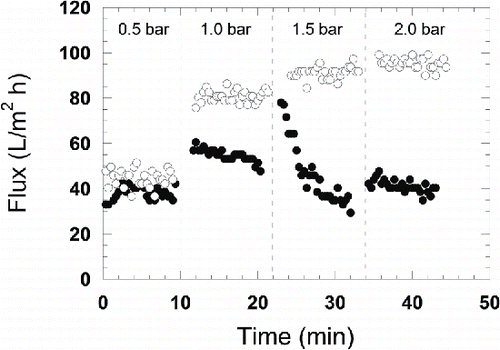
FIGURE 2 Flux during withdrawal of permeate in the experiments with process water (•) and MF permeate (o).
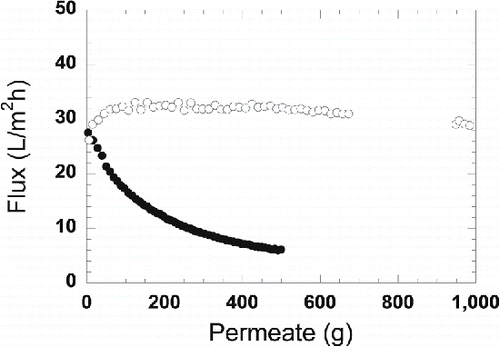
FIGURE 3 Average pure water flux recovery of the duplicate experiments, where the bars show the maximum and minimum values, after rinsing the fouled membranes with deionized water, cleaning with the alkaline cleaning agent Ultrasil 10 (U10), and cleaning with the acidic cleaning agent Ultrasil 73 (U73).
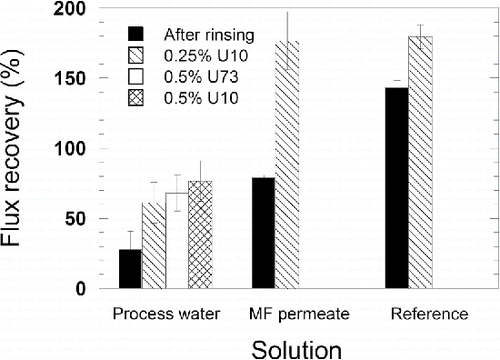
FIGURE 4 SEM images of cleaned membranes: a) pristine reference membrane, b) membrane exposed to process water and c) membrane exposed to MF permeate. Note the different scale in b).
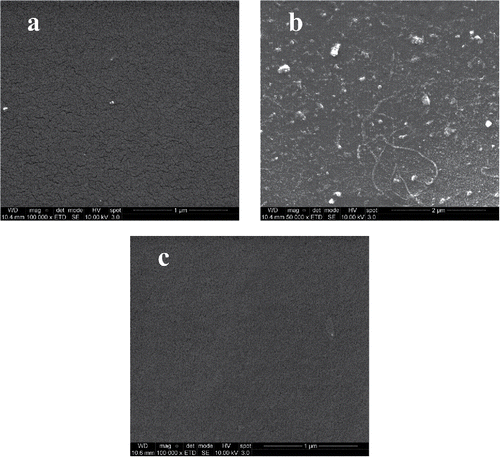
FIGURE 5 SEM-EDS spectrum for the a) pristine reference membrane, b) membrane exposed to process water and c) membrane exposed to MF permeate.
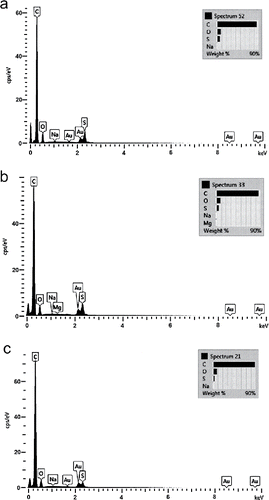
FIGURE 6 ATR-FTIR spectra of a) pristine reference membrane, b) membrane exposed to process water and c) membrane exposed to MF permeate.
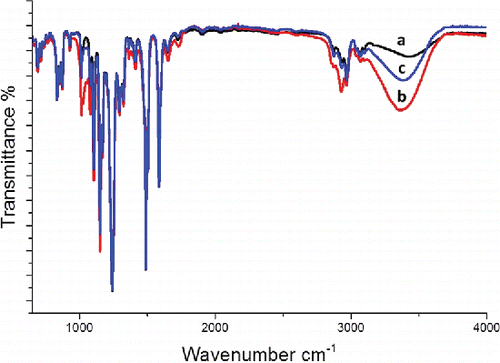
TABLE 2 ATR–FTIR peak assignments
TABLE 3 Sugars detected after acid hydrolysis of membranes exposed to process water and MF permeate