Figures & data
TABLE 1. Pelleting conditions of industrial spruce pellets and some physical properties before and after pelleting.
Figure 2 Thermogram of industrial spruce pellet showing modification range temperatures.
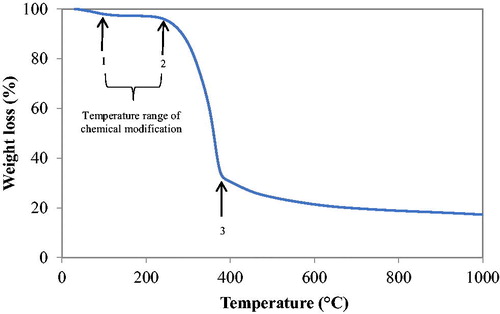
TABLE 2. Primary organic and elemental constituents of industrial spruce pellet.
Figure 1 FT-IR spectrum of industrial spruce pellet showing absorption bands that qualitatively identifies primary functional groups.
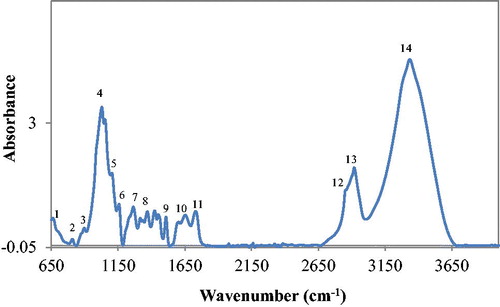
TABLE 3. FT-IR absorption bands of industrial spruce pellet and assignment of functional groups.
Figure 3 Confocal images of industrial spruce pellet showing: (a) internal structure from a section of the pellet; (b) surface structure from the same section as the previous; (c) internal structure from a different part of the pellet; (d) surface structure from same part as c. The color interpretation of the images is such that deep blue indicates the presence of cellulose, yellowish-green depicts hemicellulose, and reddish coloration implies the presence of lignin.
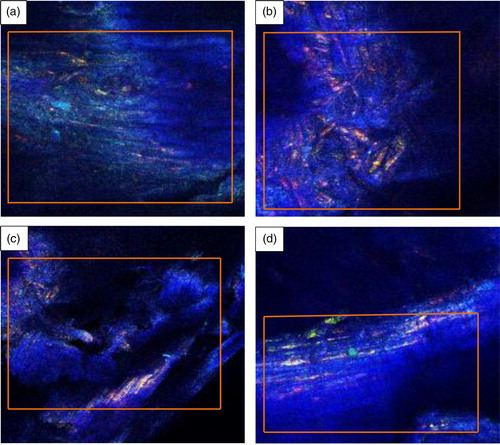
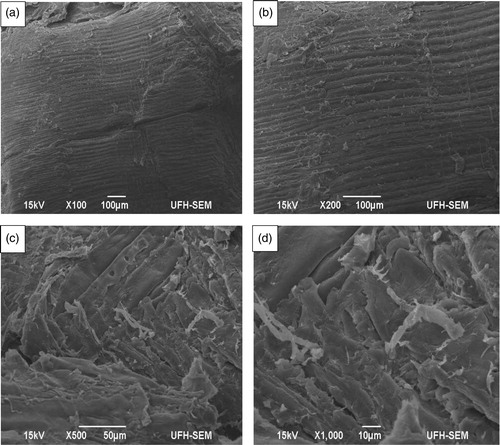
Figure 4 SEM images of industrial spruce pellet obtained at different magnifications: (a) ×100; (b) ×200; (c) ×500; (d) ×1000. The images reflect internal and surface morphology taken from different parts of the pellet.