Figures & data
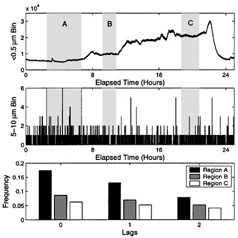
FIG. 1 An empirical demonstration that false “small-turned-large” particle detections are rare. The first panel shows a 25 h time series of particle counts in the 0.3–0.5 μm bin. The ordinate gives number of particles in this size range, detected in a 5 s interval. The middle panel, taken from Figure 2 of CitationLarsen et al. 2003, shows a simultaneous time-series of particle counts in the 5–10 μm size bin. Three shaded regions—A, B, and C—were selected for their relatively constant concentrations of the smallest and most numerous aerosol particles. If small aerosol particles turn into phantom large particles, the two time series should be correlated, with large particle count being highest in region C (due to the higher concentration of small aerosol particles). No such effect is observed. Furthermore, the phantoms should yield a relative abundance of short delay times between large particles. To test this, the bottom panel displays the frequency that, after detecting one 5–10 μm particle, the next 5–10 μm particle is detected “Lags” later. Each lag is many hundreds of pulse decay times so, if phantoms dominate the signal, we would expect that for “Lags = 0” the frequency in region C should be larger than that for regions A or B. Again, this is not observed. We conclude that, therefore, the detected correlations are not due to phantom detections, conjectured in CitationLawless 2003.