3,328
Views
71
CrossRef citations to date
0
Altmetric
Original Articles

Method for Measuring Effective Density and Fractal Dimension of Aerosol Agglomerates

, &
Pages 437-446 | Received 01 Aug 2003, Accepted 01 Feb 2004, Published online: 17 Aug 2010

Figures & data

FIG. 1 Parameters varied in density fitting method (see text). The slope of the curve (3-d f ) depends on the structure of particles.
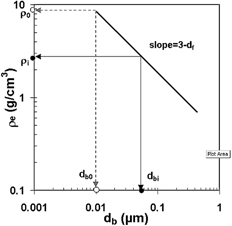
FIG. 1 Parameters varied in density fitting method (see text). The slope of the curve (3-d f ) depends on the structure of particles.

FIG. 2 Different phases of the fitting procedure and the resulting density versus mobility diameter curve.
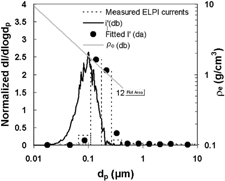
FIG. 2 Different phases of the fitting procedure and the resulting density versus mobility diameter curve.

TABLE 1 Range of parameter values used in simulation

FIG. 3 Fitted fractal dimension values versus input values. Simulation result with noise added to individual ELPI and SMPS channel signals.
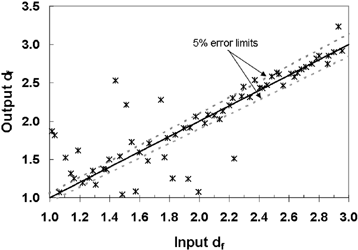
FIG. 3 Fitted fractal dimension values versus input values. Simulation result with noise added to individual ELPI and SMPS channel signals.

FIG. 4 Fitted fractal dimension versus input fractal dimension. Simulation result with input CMD 100 nm, GSD 1.7, and input ρ i 1.0 g/cm3; 100 simulation runs per each input value, with noise in individual channel signals of ELPI and SMPS. The error bars indicate standard deviation of the 100 runs.
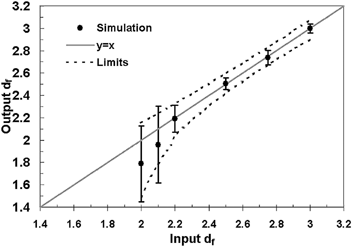
FIG. 4 Fitted fractal dimension versus input fractal dimension. Simulation result with input CMD 100 nm, GSD 1.7, and input ρ i 1.0 g/cm3; 100 simulation runs per each input value, with noise in individual channel signals of ELPI and SMPS. The error bars indicate standard deviation of the 100 runs.

FIG. 5 Measurement setup.

FIG. 5 Measurement setup.

FIG. 6 (a) Set of measured silver particle distributions and resulted fractal dimensions. (b) Density values for Aged II particles gained from reference method are compared to results found by fitting method in figure.
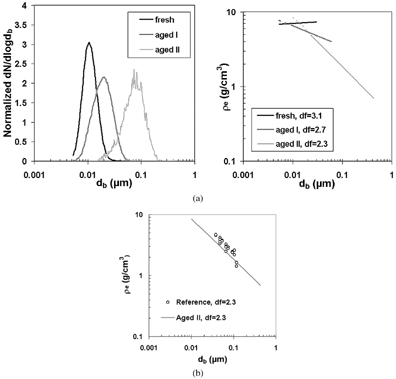
FIG. 6 (a) Set of measured silver particle distributions and resulted fractal dimensions. (b) Density values for Aged II particles gained from reference method are compared to results found by fitting method in figure.

FIG. 7 Electron microscope images of fresh silver particles on the left and Aged II particles (ageing time 15 min) on the right.
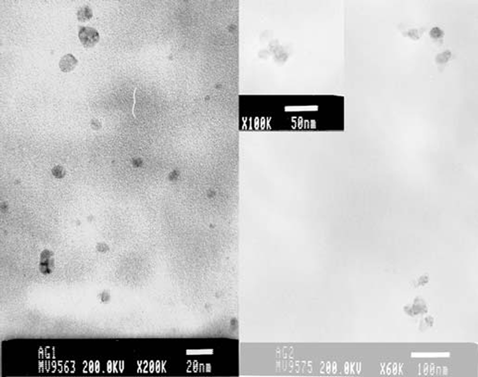
FIG. 7 Electron microscope images of fresh silver particles on the left and Aged II particles (ageing time 15 min) on the right.

FIG. 8 Measured fractal dimension values and error limits compared with error limits found in simulations. Note that no reference value for Silver Aged I is available; place in x axis is the average of measured values.
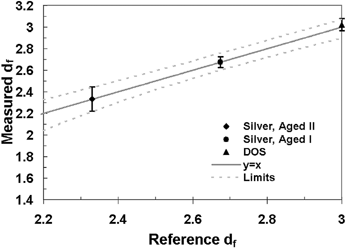
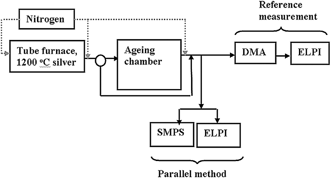
FIG. 8 Measured fractal dimension values and error limits compared with error limits found in simulations. Note that no reference value for Silver Aged I is available; place in x axis is the average of measured values.

TABLE 2 Summary of the results

Reprints and Corporate Permissions

Please note: Selecting permissions does not provide access to the full text of the article, please see our help page How do I view content?

To request a reprint or corporate permissions for this article, please click on the relevant link below:

Academic Permissions

Please note: Selecting permissions does not provide access to the full text of the article, please see our help page How do I view content?

Obtain permissions instantly via Rightslink by clicking on the button below:

If you are unable to obtain permissions via Rightslink, please complete and submit this Permissions form. For more information, please visit our Permissions help page.