2,610
Views
25
CrossRef citations to date
0
Altmetric
Original Articles

Method to Determine the Number of Bacterial Spores Within Aerosol Particles

, , &
Pages 960-965 | Received 28 Oct 2004, Accepted 19 Apr 2005, Published online: 23 Feb 2007

Figures & data

FIG. 1 Image of aerosolized spores. Metered dose inhalers were filled with (5 ml) spores of Bacillus globigii 0.05% w/w using Dymel 134a as propellant (DuPont, Wilmington, DE 19898). Applications of aerosols with the metered dosed inhaler were contained inside a disposable 45-gallon disposable polyethylene bag held with tape to a wire skeleton (0.80 m long by 0.50 m wide by 0.40 m high). The structured bag was placed inside a Biosafety Level-II cabinet. The aerosol generator was operated inside the bag by inserting a hand through the bag opening. Aerosol particles from the generator were collected on glass microscope slides, which were cleaned and rinsed with ethanol prior to use. The glass slides were situated at 25 cm from the aerosol generator, in a vertical orientation and centered at the same height with the nozzle. After aerosol impact, the slides were removed from the bag and very gently covered with 2 or 3 cover slips and their corners sealed with washable glue. The slides were analyzed in a Leica DMR Optical Microscope (Leica Microsystems Inc.) under differential interference contrast (DIC). Several pictures were taken randomly across slides in a raster pattern scan to cover representative areas of slides. A) DIC micrograph employing a 100 × oil immersion objective to reach a maximum magnification of 1,000 ×. B) The area framed in A further digitally magnified three times.
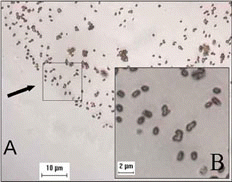
FIG. 1 Image of aerosolized spores. Metered dose inhalers were filled with (5 ml) spores of Bacillus globigii 0.05% w/w using Dymel 134a as propellant (DuPont, Wilmington, DE 19898). Applications of aerosols with the metered dosed inhaler were contained inside a disposable 45-gallon disposable polyethylene bag held with tape to a wire skeleton (0.80 m long by 0.50 m wide by 0.40 m high). The structured bag was placed inside a Biosafety Level-II cabinet. The aerosol generator was operated inside the bag by inserting a hand through the bag opening. Aerosol particles from the generator were collected on glass microscope slides, which were cleaned and rinsed with ethanol prior to use. The glass slides were situated at 25 cm from the aerosol generator, in a vertical orientation and centered at the same height with the nozzle. After aerosol impact, the slides were removed from the bag and very gently covered with 2 or 3 cover slips and their corners sealed with washable glue. The slides were analyzed in a Leica DMR Optical Microscope (Leica Microsystems Inc.) under differential interference contrast (DIC). Several pictures were taken randomly across slides in a raster pattern scan to cover representative areas of slides. A) DIC micrograph employing a 100 × oil immersion objective to reach a maximum magnification of 1,000 ×. B) The area framed in A further digitally magnified three times.

FIG. 2 Computer-assisted image analysis of aerosol particles. Imaging analysis of the pictures was performed using the Image Pro Express software (Media Cybernetics L.P Silver Spring, Maryland, USA) and Image J 1.31 (an image processing and analysis software in Java format developed at the National Institutes of Health, Bethesda, Maryland which is in the public domain). A) DIC micrograph of B. globigii spores within aerosol particles observed at 1000 × optical magnification and further enlarged digitally to identify individual and clustered spores. B) Particle boundaries obtained from picture A by computer-assisted analysis. Direct comparison of panels A and B allows correlation between particle size and the number of spores inside each particle.
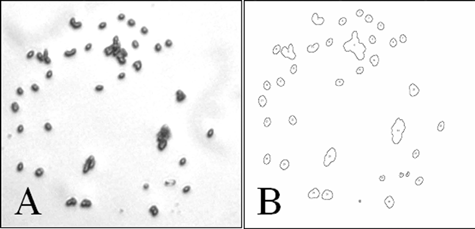
FIG. 2 Computer-assisted image analysis of aerosol particles. Imaging analysis of the pictures was performed using the Image Pro Express software (Media Cybernetics L.P Silver Spring, Maryland, USA) and Image J 1.31 (an image processing and analysis software in Java format developed at the National Institutes of Health, Bethesda, Maryland which is in the public domain). A) DIC micrograph of B. globigii spores within aerosol particles observed at 1000 × optical magnification and further enlarged digitally to identify individual and clustered spores. B) Particle boundaries obtained from picture A by computer-assisted analysis. Direct comparison of panels A and B allows correlation between particle size and the number of spores inside each particle.

FIG. 3 Size distribution of aerosol particles determined by computer-assisted analysis. Pictures were obtained and analyzed with the Image-J software as described in ) The Ferret's diameter of each particle was assigned and the bar heights represent the frequency of particles grouped accordingly to the diameters indicated in the X-axis. B) The area of each particle was calculated and correlated with the number of spores by training the software as described in the text. The bars represent the frequency of particles with the number of spores indicated in the X-axis.
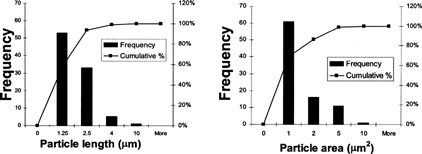
FIG. 3 Size distribution of aerosol particles determined by computer-assisted analysis. Pictures were obtained and analyzed with the Image-J software as described in Figure 2A) The Ferret's diameter of each particle was assigned and the bar heights represent the frequency of particles grouped accordingly to the diameters indicated in the X-axis. B) The area of each particle was calculated and correlated with the number of spores by training the software as described in the text. The bars represent the frequency of particles with the number of spores indicated in the X-axis.

Table 1 Spore distribution by computer or visual analysis

FIG. 4 Distribution of spores inside aerosol particles at various distances. The glass slides were situated as described in the legend of at various distances from the pressurized metered inhaler. The height of the bars represents the percentage of particles containing the number of spores indicated in the X-axis and collected at 10 cm (light bars), 15 cm (gray bars) and 25 cm (dark bars) from the aerosol source. The bracket on top of the bars represents the standard deviation obtained after counting a total of 1,800 particles.
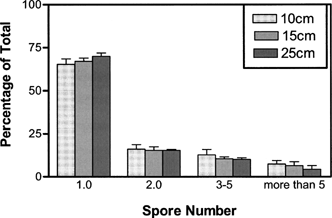
FIG. 4 Distribution of spores inside aerosol particles at various distances. The glass slides were situated as described in the legend of Figure 1 at various distances from the pressurized metered inhaler. The height of the bars represents the percentage of particles containing the number of spores indicated in the X-axis and collected at 10 cm (light bars), 15 cm (gray bars) and 25 cm (dark bars) from the aerosol source. The bracket on top of the bars represents the standard deviation obtained after counting a total of 1,800 particles.

FIG. 5 Aerosols collected with an Andersen cascade impactor. Spores of B. globigii were delivered into a 0.26 m by 0.26 m by 1.00 m high plexi-glass box. The air in the box was heated using a hot plate for faster drying of the aerosols. The temperature and humidity inside the chamber were 30 C° and 36% respectively. The aerosol in the box was mixed using a fan. Aerosol particles were collected with components of a six-stage cascade impactor (Andersen Sampler Inc., Atlanta, GA) using an airflow of 28.3 liters/min, according to manufacturer's instructions. In normal operation, agar filled petri dishes are placed in the impactor for collecting and culturing bioaerosols, however, in this test particles were collected onto microscope slides for counting. Paraffin wax was used to fill a petri dish to the appropriate height for the correct operation of the impactor and a microscope slide was placed in the petri dish on top of the wax to collect the particles. A micrographic image of a characteristic sample obtained after removing stages 1, 2, 4, and 5 from the cascade impactor and using only stages 3 as a fractionator to remove large particles and 6 to collect particles with aerodynamic diameters between 0.65 μ m and 3.3 μ m is shown in the Inset. The heights of the bars represent the percentage of particles containing the number of spores indicated on the X-axis. The bracket on top of the bars represents the standard deviation of the mean percentage obtained over three runs counting 200–250 particles on each slide for a total of 700 particles.
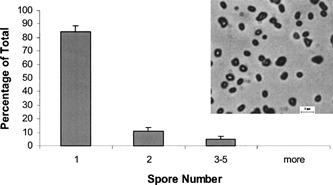
FIG. 5 Aerosols collected with an Andersen cascade impactor. Spores of B. globigii were delivered into a 0.26 m by 0.26 m by 1.00 m high plexi-glass box. The air in the box was heated using a hot plate for faster drying of the aerosols. The temperature and humidity inside the chamber were 30 C° and 36% respectively. The aerosol in the box was mixed using a fan. Aerosol particles were collected with components of a six-stage cascade impactor (Andersen Sampler Inc., Atlanta, GA) using an airflow of 28.3 liters/min, according to manufacturer's instructions. In normal operation, agar filled petri dishes are placed in the impactor for collecting and culturing bioaerosols, however, in this test particles were collected onto microscope slides for counting. Paraffin wax was used to fill a petri dish to the appropriate height for the correct operation of the impactor and a microscope slide was placed in the petri dish on top of the wax to collect the particles. A micrographic image of a characteristic sample obtained after removing stages 1, 2, 4, and 5 from the cascade impactor and using only stages 3 as a fractionator to remove large particles and 6 to collect particles with aerodynamic diameters between 0.65 μ m and 3.3 μ m is shown in the Inset. The heights of the bars represent the percentage of particles containing the number of spores indicated on the X-axis. The bracket on top of the bars represents the standard deviation of the mean percentage obtained over three runs counting 200–250 particles on each slide for a total of 700 particles.

Reprints and Corporate Permissions

Please note: Selecting permissions does not provide access to the full text of the article, please see our help page How do I view content?

To request a reprint or corporate permissions for this article, please click on the relevant link below:

Academic Permissions

Please note: Selecting permissions does not provide access to the full text of the article, please see our help page How do I view content?

Obtain permissions instantly via Rightslink by clicking on the button below:

If you are unable to obtain permissions via Rightslink, please complete and submit this Permissions form. For more information, please visit our Permissions help page.