1,522
Views
68
CrossRef citations to date
0
Altmetric
Original Articles

High Precision Density Measurements of Single Particles: The Density of Metastable Phases

, , &
Pages 972-986 | Received 29 Jan 2005, Accepted 27 Sep 2005, Published online: 23 Feb 2007

Figures & data

FIG. 1 A schematic representation of the SPLAT/DMA system for measuring particle density. The specific setup is designed to make high precision measurements of the density of hygroscopic particles with oil as the calibrant. Atomizer 1 is used to aerosolize a water solution of the substance of interest. The aerosol flow is dried using two diffusion dryers, and by dilution with dry air. The calibrant is aerosolized from a neat solution and mixed with the unknown flow in the dilution and mixing chamber. The externally mixed polydisperse aerosol is passed through the DMA to generate a monodisperse aerosol, the aerodynamic diameter of which is measured by SPLAT.
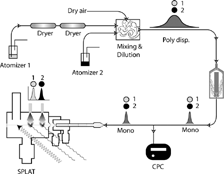
FIG. 1 A schematic representation of the SPLAT/DMA system for measuring particle density. The specific setup is designed to make high precision measurements of the density of hygroscopic particles with oil as the calibrant. Atomizer 1 is used to aerosolize a water solution of the substance of interest. The aerosol flow is dried using two diffusion dryers, and by dilution with dry air. The calibrant is aerosolized from a neat solution and mixed with the unknown flow in the dilution and mixing chamber. The externally mixed polydisperse aerosol is passed through the DMA to generate a monodisperse aerosol, the aerodynamic diameter of which is measured by SPLAT.

FIG. 2 a) Measured time of flights between the two optical detection stages for PSL particles of the sizes specified in the figure. b) A log/log plot of the observed particle time of flights shown in a) versus the PSL particle known vacuum aerodynamic diameters. The linear fit is the empirically derived calibration. c) and d) Expanded views of the observed vacuum aerodynamic size distributions for 199 nm and 799 nm PSL particles showing the instruments sizing resolution.
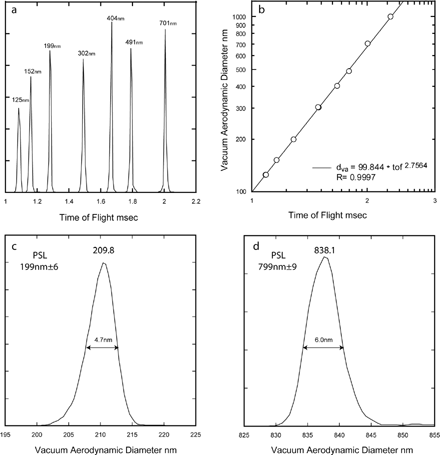
FIG. 2 a) Measured time of flights between the two optical detection stages for PSL particles of the sizes specified in the figure. b) A log/log plot of the observed particle time of flights shown in a) versus the PSL particle known vacuum aerodynamic diameters. The linear fit is the empirically derived calibration. c) and d) Expanded views of the observed vacuum aerodynamic size distributions for 199 nm and 799 nm PSL particles showing the instruments sizing resolution.

FIG. 3 Measured vacuum aerodynamic diameter distributions for 302 nm PSL particles aerosolized from suspensions of successively increasing concentrations labeled (1) through (4). The asymmetrically shaded area was obtained by subtracting from curve (4) curve (1)*0.4. The shaded curve is assigned to aspherical PSL particles with nodules containing impurities. The microscopic image to the left is of a spherical PSL particle, while the one on the right shows the presence of two impurity nodules. (The microscopic images are of 240 nm PSL particles).
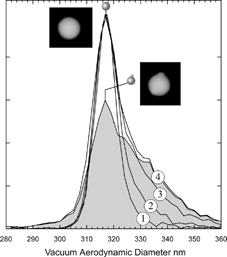
FIG. 3 Measured vacuum aerodynamic diameter distributions for 302 nm PSL particles aerosolized from suspensions of successively increasing concentrations labeled (1) through (4). The asymmetrically shaded area was obtained by subtracting from curve (4) curve (1)*0.4. The shaded curve is assigned to aspherical PSL particles with nodules containing impurities. The microscopic image to the left is of a spherical PSL particle, while the one on the right shows the presence of two impurity nodules. (The microscopic images are of 240 nm PSL particles).

FIG. 4 Measured vacuum aerodynamic diameter for singlets and doublets of 302 nm PSL particles (dashed and solid lines, respectively). The singlets line width is 3% (FWHM), while the line shape corresponding to the doublets is asymmetric and is 11% (FWHM) wide.
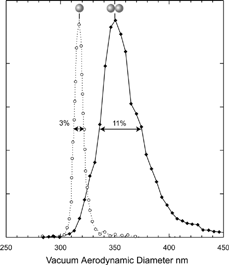
FIG. 4 Measured vacuum aerodynamic diameter for singlets and doublets of 302 nm PSL particles (dashed and solid lines, respectively). The singlets line width is 3% (FWHM), while the line shape corresponding to the doublets is asymmetric and is 11% (FWHM) wide.

FIG. 5 Measured vacuum aerodynamic diameter for 200 nm mobility diameter Fomblin oil and ammonium sulfate particles. The observed spreads in vacuum aerodynamic diameters are 5% and 10% (FWHM) for Fomblin and ammonium sulfate respectively. The micrographs on the left are of the same size ammonium sulfate particles.
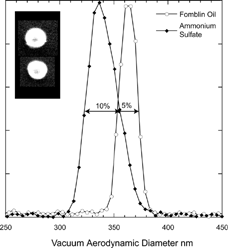
FIG. 5 Measured vacuum aerodynamic diameter for 200 nm mobility diameter Fomblin oil and ammonium sulfate particles. The observed spreads in vacuum aerodynamic diameters are 5% and 10% (FWHM) for Fomblin and ammonium sulfate respectively. The micrographs on the left are of the same size ammonium sulfate particles.

FIG. 6 Measured vacuum aerodynamic diameters of 320 nm, 350 nm, and 380 nm mobility diameters PMMA particles. The line widths illustrate the SPLAT/DMA overall sizing resolution.
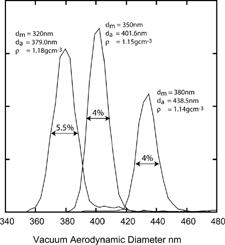
FIG. 6 Measured vacuum aerodynamic diameters of 320 nm, 350 nm, and 380 nm mobility diameters PMMA particles. The line widths illustrate the SPLAT/DMA overall sizing resolution.

FIG. 7 Comparison of measured and known densities for the substances listed in . The solid line is a fit to the data.
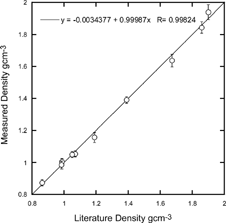
FIG. 7 Comparison of measured and known densities for the substances listed in Table 1. The solid line is a fit to the data.

TABLE 1 Measured particle densities, bulk densities, and uncertainties and errors

FIG. 8 Measured densities for DOP particles as a function of particle size. A total of 83 measurements yield an average density of 1.003 g/cc and a spread of ± 2.02% (shaded area).
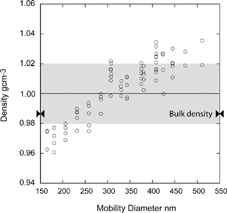
FIG. 8 Measured densities for DOP particles as a function of particle size. A total of 83 measurements yield an average density of 1.003 g/cc and a spread of ± 2.02% (shaded area).

FIG. 9 Measured vacuum aerodynamic diameter of 200 nm mobility diameter DOP particles. The symbols “+, ++, …” denote particle charge.
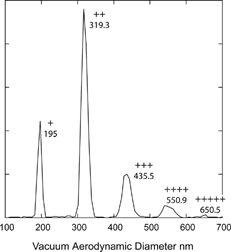
FIG. 9 Measured vacuum aerodynamic diameter of 200 nm mobility diameter DOP particles. The symbols “+, ++, …” denote particle charge.

FIG. 10 Measured vacuum aerodynamic diameters of 200 nm mobility diameter DOP and Pump Oil particles. The symbols “+, ++, …” denote particle charge.
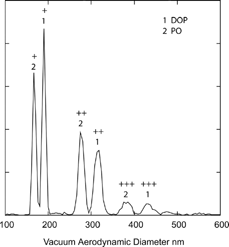
FIG. 10 Measured vacuum aerodynamic diameters of 200 nm mobility diameter DOP and Pump Oil particles. The symbols “+, ++, …” denote particle charge.

Table 2 High precision measurements of oil droplets densities

FIG. 11 A schematic of hydration and dehydration cycles for single component hygroscopic substances in small particle form. See text for detailed description of the three depicted cases.
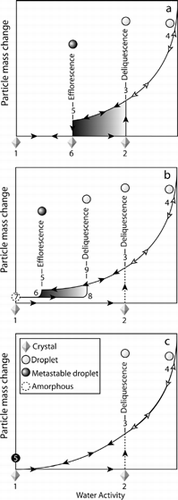
FIG. 11 A schematic of hydration and dehydration cycles for single component hygroscopic substances in small particle form. See text for detailed description of the three depicted cases.

FIG. 12 Measured vacuum aerodynamic diameters of 300 nm mobility diameter Ca(NO3)2 and Fomblin particles. The inset shows a schematic, based on CitationTang and Fung (1997), of the hydration and dehydration hysteresis loop for the amorphous Ca(NO3)2 particles.
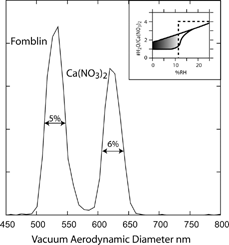
FIG. 12 Measured vacuum aerodynamic diameters of 300 nm mobility diameter Ca(NO3)2 and Fomblin particles. The inset shows a schematic, based on CitationTang and Fung (1997), of the hydration and dehydration hysteresis loop for the amorphous Ca(NO3)2 particles.

TABLE 3 Extrapolated and observed densities for metastable phases and bulk crystal densities

FIG. 14 A plot of solution concentration as a function of water activity for the systems under study. The plot is based on the CitationClegg et al. (1998) model, which is reliable only down to water activity of 0.1. The dotted lines are extrapolations of the model. The dashed lines indicate deliquescence points and in the case of sodium bisulfate the anhydrous to monohydrate transition as well. The shaded areas indicate regions of metastablility.
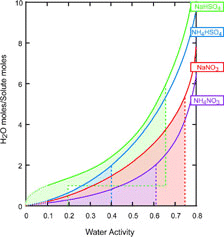
FIG. 14 A plot of solution concentration as a function of water activity for the systems under study. The plot is based on the CitationClegg et al. (1998) model, which is reliable only down to water activity of 0.1. The dotted lines are extrapolations of the model. The dashed lines indicate deliquescence points and in the case of sodium bisulfate the anhydrous to monohydrate transition as well. The shaded areas indicate regions of metastablility.

FIG. 13 Measured vacuum aerodynamic diameters of 209 nm mobility diameter NH4NO3 particles. The inset shows an expanded scale of the larger size particles.
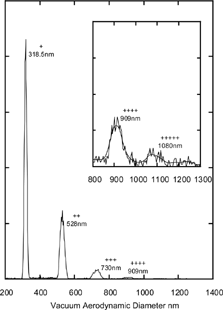
FIG. 13 Measured vacuum aerodynamic diameters of 209 nm mobility diameter NH4NO3 particles. The inset shows an expanded scale of the larger size particles.

Reprints and Corporate Permissions

Please note: Selecting permissions does not provide access to the full text of the article, please see our help page How do I view content?

To request a reprint or corporate permissions for this article, please click on the relevant link below:

Academic Permissions

Please note: Selecting permissions does not provide access to the full text of the article, please see our help page How do I view content?

Obtain permissions instantly via Rightslink by clicking on the button below:

If you are unable to obtain permissions via Rightslink, please complete and submit this Permissions form. For more information, please visit our Permissions help page.