Figures & data
TABLE 1 Average hourly concentrations of OC, thermal EC, BC, and OM
FIG. 1 Diurnal variations of hourly BC and UV-BC concentrations from the two-wavelength AE-20 Aethalometer for (a) average concentrations and (b) median concentrations.
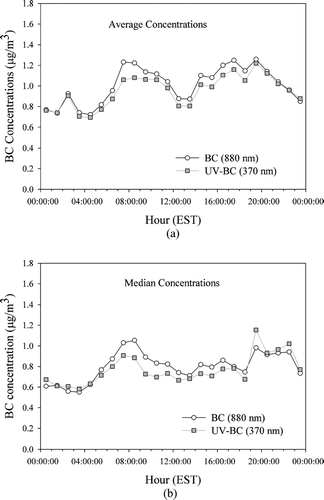
FIG. 2 Comparison between collocated Aethalometer BC concentrations and (a) Sunset thermal EC, (b) R&P 5400 thermal EC, and (c) STN and ASRC 24-hour filter EC concentrations.
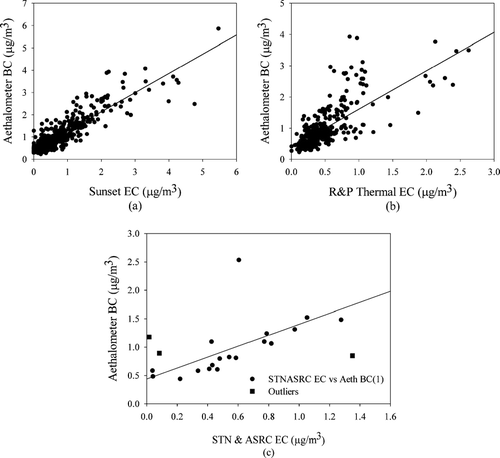
FIG. 3 (a) Average hourly Sunset thermal EC, Sunset OC and ozone concentrations in Flushing, New York during January 12–February 5, 2004, and (b) Average hourly Sunset thermal EC, Sunset optical EC and Aethalometer BC concentrations during the same period.
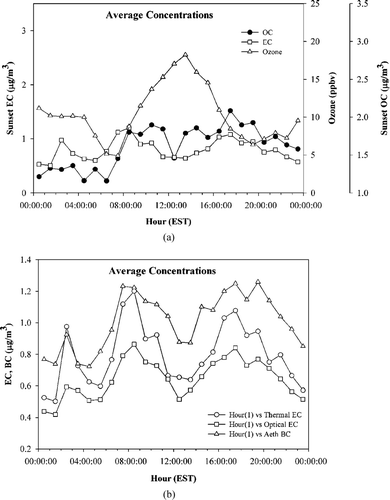
FIG. 4 Comparison between (a) Sunset optical EC and Sunset thermal EC, and (b) Sunset optical EC and Aethalometer BC in Flushing, New York during January 12–February 5, 2004.
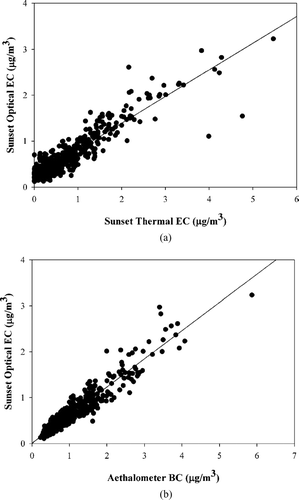
TABLE 2 Collocated comparisons among semi-continuous and filter based carbon measurements
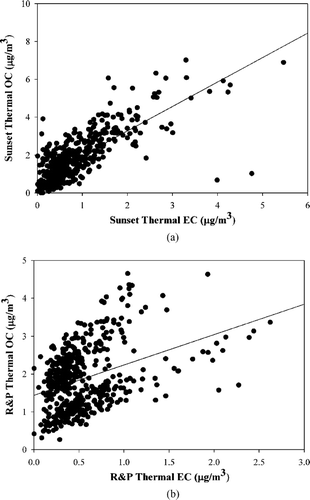
FIG. 5 Comparison of hourly measured OC and thermal EC from (a) Sunset OC/EC analyzer, and (b) R&P 5400 carbon monitor.