Figures & data
FIG. 1 Schematic Diagram of Continuous Flow Diffusion Chamber (CFDC) at Dalhousie University, Canada. Arrows indicate the airflow of the CFDC system. EWLDT = External Water Level Detection Tube, WT = Water Tank, WP = Water Pump, DR = Drierite holder, F = Inline Filter, FM = Flow Meter, PD = Pulse Dampeners, AP = Air Pump, IM = Impactor, and HD = Computer Hard Disk.
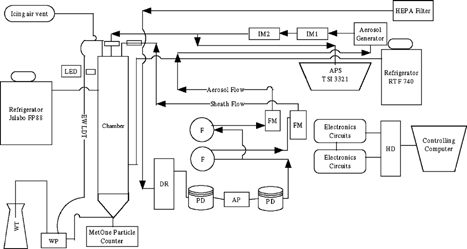
FIG. 2 Aerosol particle size distribution of kaolinite (right scale) and montmorillonite (left scale) mineral dust particles measured with Aerodynamic Particle Sizer (APS) and exiting impactor in the aerosol generation. Noise level is determined with blank and dry experiments for diameters 5 μ m and above.
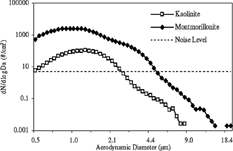
FIG. 3 Active ice nuclei (%) versus temperature (°C) of kaolinite (a) and montmorillonite (b) mineral dust particles at 100% relative humidity with respect to water (RHw) in deposition freezing mode. The active ice nuclei fractions are calculated from the ratio of the ice crystal number concentration active at a given temperature over the total number of ice crystals at 100% relative humidity with respect to water (RHw) at −40°C. The respective relative humidity with respect to ice (RHi) in % is indicated below the temperatures values on the x-axis.
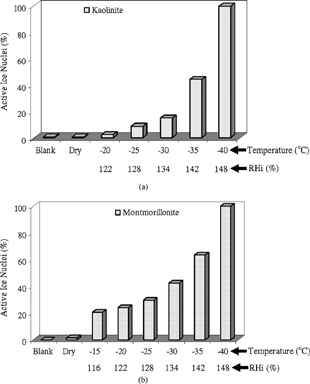
TABLE 1 Activation temperatures of kaolinite and montmorillonite mineral dust particles for various nucleation modes. The activation temperature is defined as the temperature at which the number of ice crystals greater than 5 μ m is at least 1% of the number particles measured during ice nucleation experiments between 1 and 2 μ m in diameter
FIG. 4 Onset relative humidity determination of kaolinite (a) and montmorillonite (b) activation (%) in deposition ice nucleation at −30°C. The active ice nuclei fractions are calculated from the ratio of the ice crystal number concentration active at a given relative humidity with respect to ice over the total number of ice crystals at 0% supersaturation (100% RHw) at −40°C. The vertical bars are the error bars; the error bars in and are the standard deviation of the measurements (n = 15) conducted at each temperature and relative humidity.
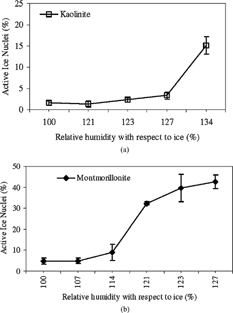
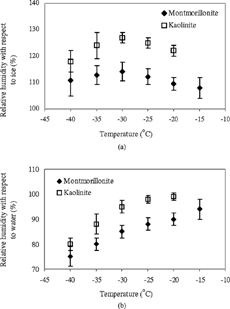
FIG. 5 The variation of the onset relative humidity with respect (RH) to ice (a) and water (b) with temperature (°C) of kaolinite and montmorillonite mineral dust particles activation in deposition ice nucleation. The vertical bars are the error bars; they are the median of the difference between two observations at different relative humidities (differences range from 4 to 12% with respect to ice, and from 3 to 8% with respect to water) at a particular temperature.