Figures & data
FIG. 1 Schematic diagram of the filter vibration test system.
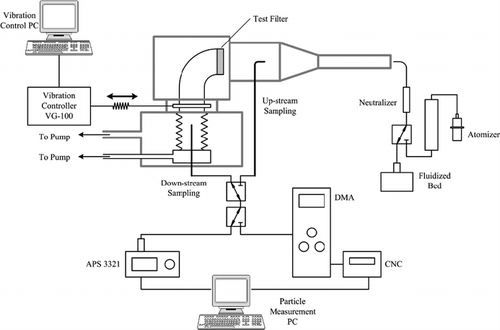
FIG. 2 Size distributions of ARD generated by an atomizer and a fluidized bed.
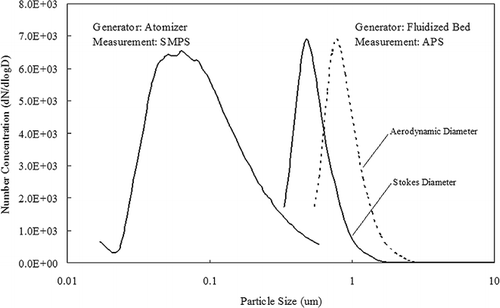
FIG. 3 SEM photographs of ARD generated by an atomizer (a), (b) and by a fluidized bed (c), (d).
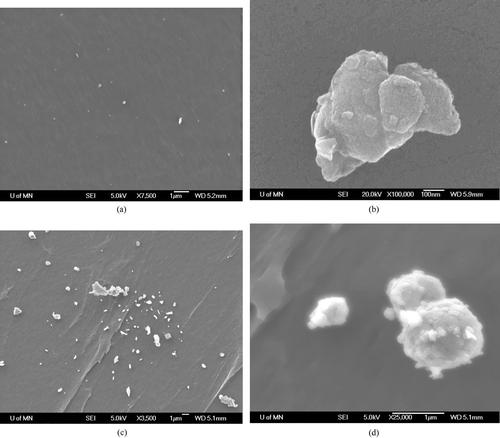
FIG. 4 Filtration efficiency as a function of particle size for different face velocities.
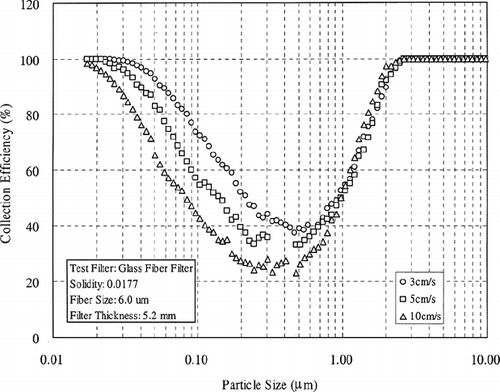
FIG. 5 Filtration efficiency for different vibration peak velocities (a) Vf = 3 cm/s; (b) Vf = 5 cm/s; (c) Vf = 10 cm/s.
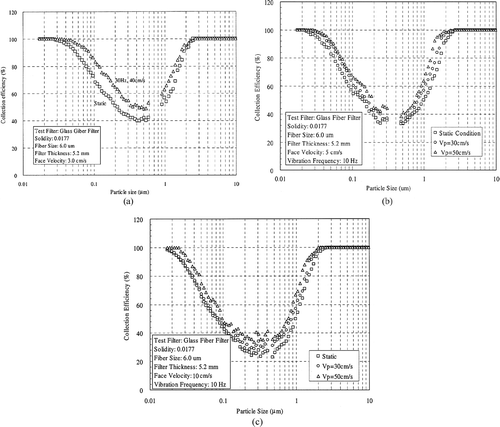
FIG. 6 Single fiber efficiency as a function of Peclet number for the static conditions with various face velocities.
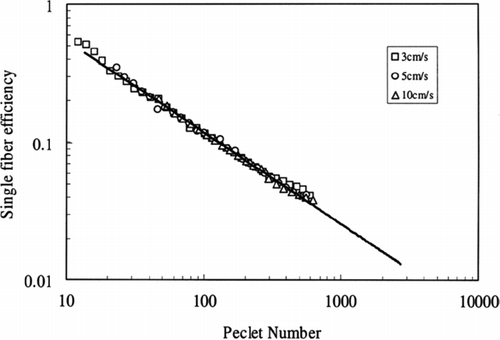
FIG. 7 Single fiber efficiency as a function of Peclet for the various vibration conditions (a) 10 Hz; (b) 30 Hz.
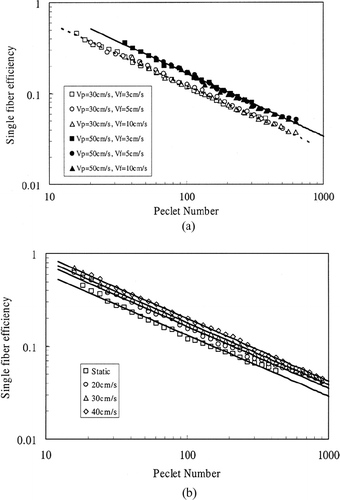
FIG. 8 The constants (a) C1 (r2 = 0.9323) and (b) C2 (r2 = 0.9344) of Equation (Equation7).
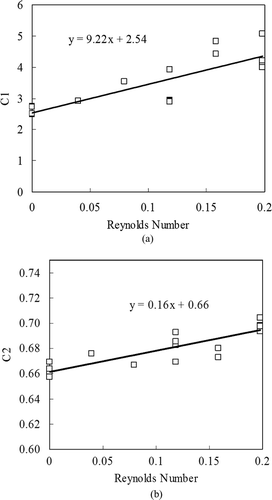
FIG. 9 Vibration effect on the particle impaction deposition.
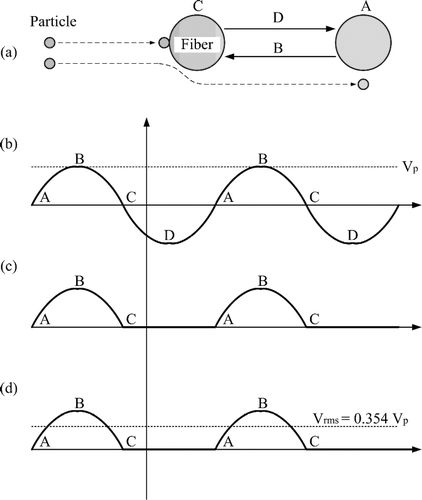
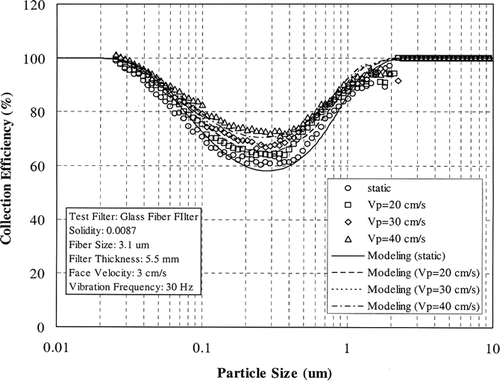
FIG. 10 Comparison between experimental results and the modeling for the various vibration conditions (a) Vf = 3 cm/s; (b) Vf = 5 cm/s; (c) Vf = 10 cm/s.
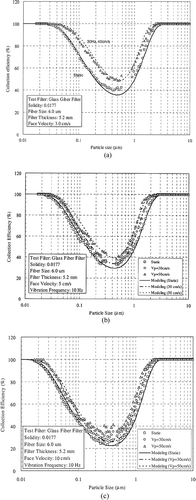
FIG. 11 Comparison between the experimental results and the modeling results for the different test filter.