Figures & data
FIG. 1 Series of processes in the Florida phosphate industry. Rectangular and oval elements of the chart represent, respectively, the type of process and the phosphate material at each process.
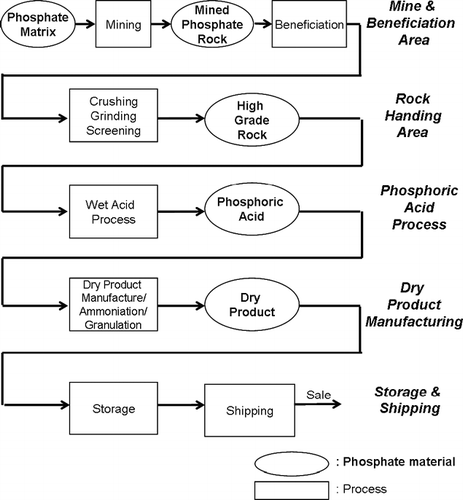
FIG. 2 The 238U decay series. The numbers in the parenthesis indicate the physical half-life of each radionuclide.
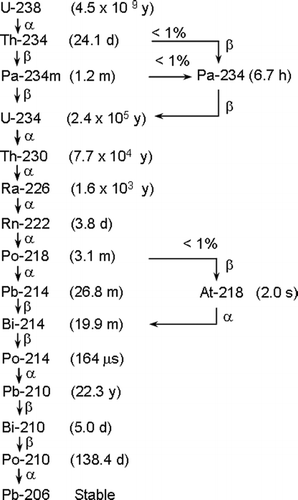
TABLE 1 Footnote a ICRP 66 Footnote b HRTM default aerosol parameters and input aerosol parameters for dose sensitivity study
FIG. 3 Aerosol size distribution. Capital letters in legend are plant identifiers. Plant A-a and Plant A-b refer to the same company plant (Plant A), but two different locations within the plant.
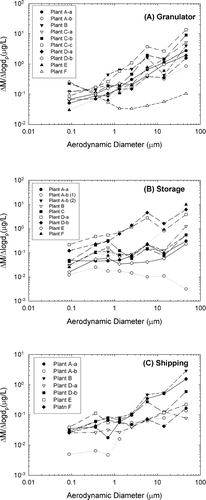
TABLE 2 Active operational systems and ventilation conditions during aerosol sampling at the various storage areas
TABLE 3 Density of bulk products, settled dusts, and aerosols
FIG. 4 Shape of particles collected at granulator area in plant A. A: 1st impactor stage particles (scale is 50 μ m), B: 4th impactor stage particles (scale is 10 μ m), and C: 7th impactor stage particles (scale is 1 μ m).
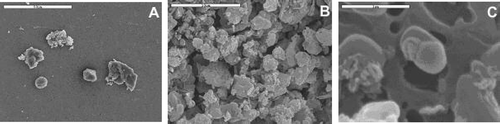
FIG. 5 Energy Dispersive X-ray Spectroscopy (EDXS) count peak of airborne particles at storage area in plant A. A: large-size particles (1st impactor stage), B: medium-size particles (4th impactor stage), and C: small-size particles (7th impactor stage).
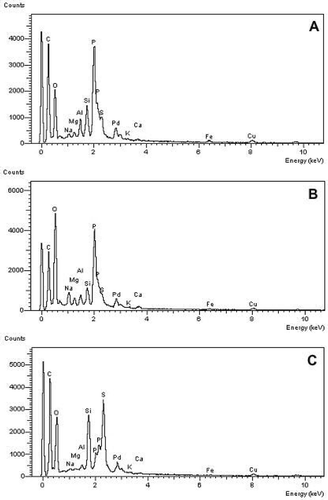
TABLE 4 Footnote a Chemical composition of dry products
TABLE 5 Phosphorus, silicon, and sulfur composition in different size particles. The types of dry products generated in plants A and D are Footnote a MAP and Footnote b DAP, respectively
TABLE 6 Radioactivity concentrations for 238U, 226Ra, and 210Pb in bulk dry products, settled dust, and sampled aerosols smaller than 10 μ m. Mean and one standard derivation are given for n > 1
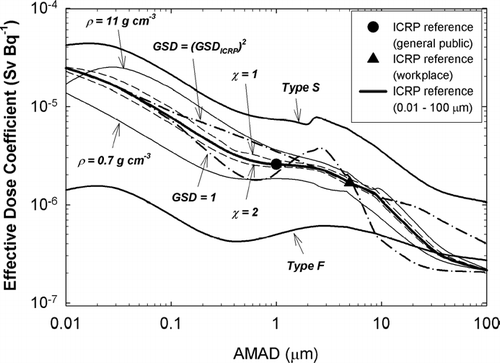
FIG. 6 Effective dose coefficient of 238U for various aerosol parameters. The other parameters except those indicated in the legend follow ICRP 66 human respiratory tract model (HRTM) default values.