Figures & data
TABLE 1 Formation yields and partitioning coefficients for the lumped category of biogenic compounds used in the UAM-AERO model
TABLE 2 Coefficients of Polynomials fi(T) used in UAM-AERO for the estimation of the nucleation rate
FIG. 1 Spatial distributions of: sulfuric acid condensational sink, sulfuric acid available for new particle formation and the nucleation rate: (a), (c), and (e) at 15:00(LST) on 24 June 2003 for the GAA, and, (b), (d), and (f) at 15:00 (LST) on 8 July 2002 for the GMA, respectively.
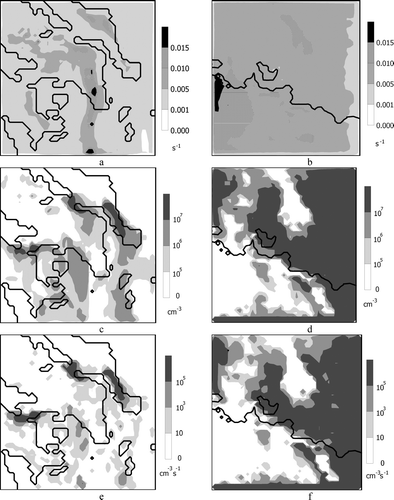
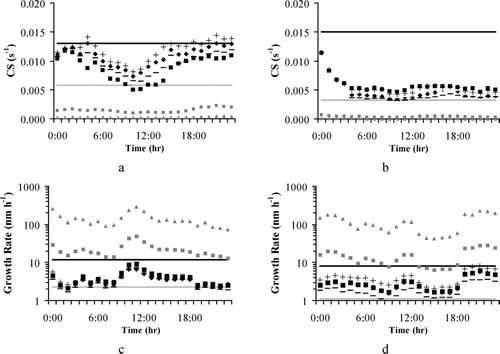
FIG. 2 Comparison of the calculated condensational sink (dots) and growth rate (dots) against observations: (a) and (c) for “Thrakomakedones” monitoring station on 24 June 2003; (b) and (d) for “Plan d' Aups” monitoring station on 8 July 2002, respectively. The black line corresponds to the upper limit of the observations while the grey line corresponds to the lower one.
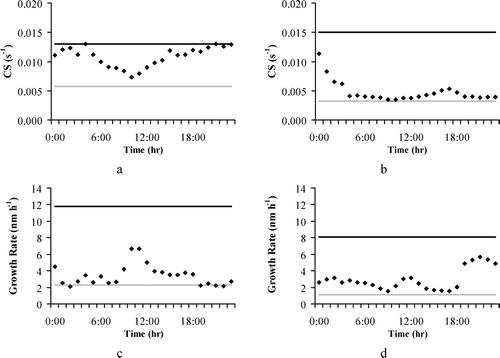
FIG. 3 Total organic mass that is calculated by the model to cross the lower diameter used by UAM-AERO (40 nm) in a 24-hour period, (a) for the GAA episode of 24 June 2003, and, (b) for the GMA episode of 8 July 2002.
FIG. 4 Spatial average concentrations of secondary organic carbon in each size bin and aerosol size distributions in a cell where nucleation is noted are presented with (black) and without (grey) nucleation: (a) and (c) at 15:00 (LST) on 24 June 2003 for the GAA; (b) and (d) at 15:00 (LST) on 8 July 2002 for the GMA, respectively.
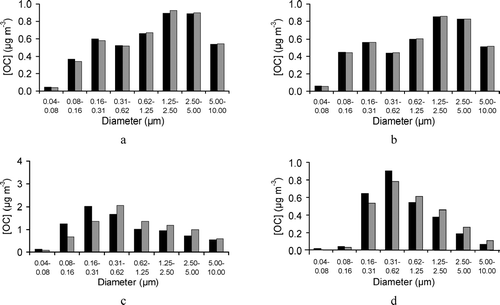
FIG. 5 CCN concentrations as a function of supersaturation (Sc) from simulations neglecting nucleation for two different aerosol chemical compositions: (1) purely inorganic aerosol composition with surface tension equal to that of pure water (black line); (2) a mixture of inorganics and organics (60% of the OC is considered as water soluble) with variable surface tension (grey line). The bar plots represent the net increase due to nucleation for the two different chemical compositions (black and grey bars, respectively) (a) Domain average for the GAA; (b) Domain average for the GMA; (c) Local change for the GAA; (d) Local change for the GMA.
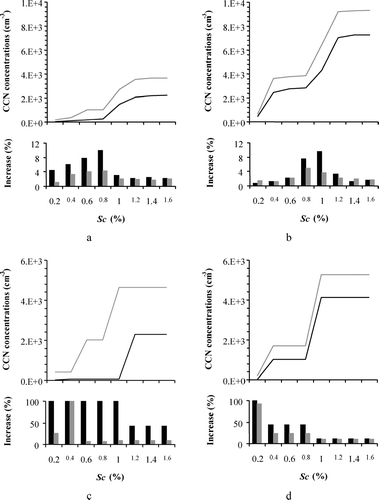
FIG. 6 Results of the sensitivity analysis for the condensational sink and growth rate (a) and (c) for “Thrakomakedones” monitoring station on 24 June 2003; (b) and (d) for “Plan d' Aups” monitoring station on 8 July 2002, respectively. The black line corresponds to the upper limit of the observations while the grey line corresponds to the lower one; also shown the results of: the base case (♦), considering a constant OC yield (▪), H equal to 10 (−) and to 25 (+), accommodation coefficients equal to 0.01 (