1,018
Views
13
CrossRef citations to date
0
Altmetric
Original Articles

Absolute Mass and Size Measurement of Monodisperse Particles Using a Modified Millikan's Method: Part II—Application of Electro-Gravitational Aerosol Balance to Polystyrene Latex Particles of 100 nm to 1 μm in Average Diameter

, &
Pages 521-535 | Received 10 Oct 2005, Accepted 23 Mar 2006, Published online: 23 Feb 2007

Figures & data

FIG. 1 Electrodes used for the electro-gravitational aerosol balance experiment.

FIG. 1 Electrodes used for the electro-gravitational aerosol balance experiment.

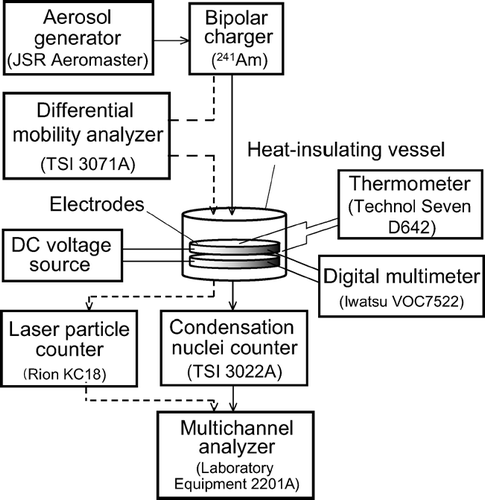
FIG. 2 Setup for the electro-gravitational aerosol balance experiment.

FIG. 2 Setup for the electro-gravitational aerosol balance experiment.

FIG. 3 Photograph of 100 nm PSL particles immersed in density reference liquids after settling for 30 days.
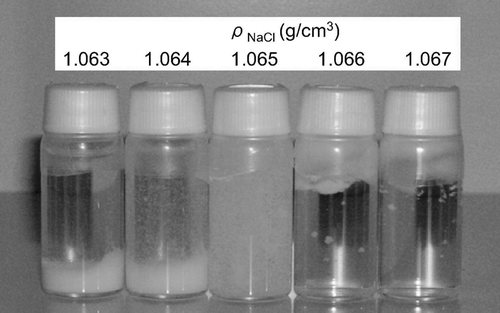
FIG. 3 Photograph of 100 nm PSL particles immersed in density reference liquids after settling for 30 days.

TABLE 1 Summary of mass and diameter measurements of PSL particles

FIG. 4 Survival rate spectrum obtained (a) for NIST SRM 1963; (b) for JSR SC-011-S. The data indicated by the empty diamonds were not included in the least squares fitting; (c) for JSR SC-021-S under two different conditions: t h = 6 h and t h = 3 h. Note that the two data sets are plotted on different scales; (d) for NIST SRM 1691. The data indicated by the empty diamonds were not included in the least squares fitting; (e) for JSR SC-048-S; (f) for NIST SRM 1690; (g) for JSR SC-101-S.
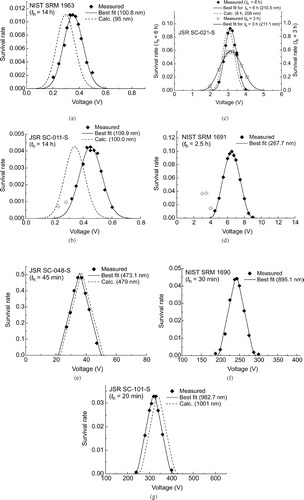
FIG. 4 Survival rate spectrum obtained (a) for NIST SRM 1963; (b) for JSR SC-011-S. The data indicated by the empty diamonds were not included in the least squares fitting; (c) for JSR SC-021-S under two different conditions: t h = 6 h and t h = 3 h. Note that the two data sets are plotted on different scales; (d) for NIST SRM 1691. The data indicated by the empty diamonds were not included in the least squares fitting; (e) for JSR SC-048-S; (f) for NIST SRM 1690; (g) for JSR SC-101-S.

TABLE 2 Summary of uncertainty analysis of D pa for NIST SRM 1963

TABLE 3 List of possible uncertainty sources not included in the uncertainty analysis

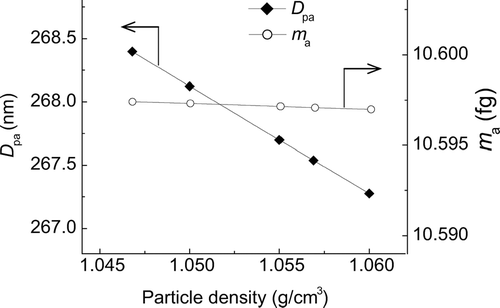
FIG. 5 Effect of the choice of ρ p on D pa and m a for NIST SRM 1691.

FIG. 5 Effect of the choice of ρ p on D pa and m a for NIST SRM 1691.

FIG. 6 Reproducibility of D pa obtained for JSR SC-021-S. The confidence interval for each of the data indicates the expanded uncertainty with a coverage factor of 2.
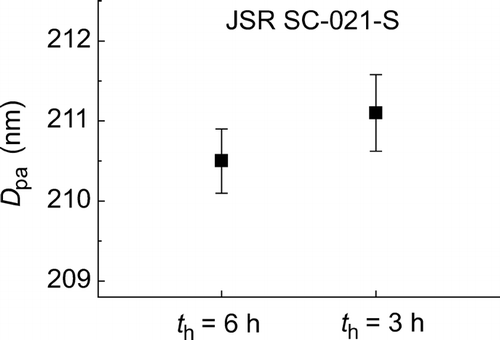
FIG. 6 Reproducibility of D pa obtained for JSR SC-021-S. The confidence interval for each of the data indicates the expanded uncertainty with a coverage factor of 2.

FIG. A1 Examples of temperature drift during the holding time on the back faces of the upper and lower electrodes. In the measurement of the No. 1 and No. 2 curves, thermistors A and B were used for the lower and upper electrodes, respectively, while in the measurements of the No. 3 and No. 4 curves, the two thermistors were exchanged.
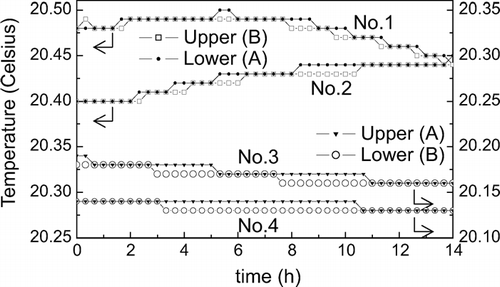
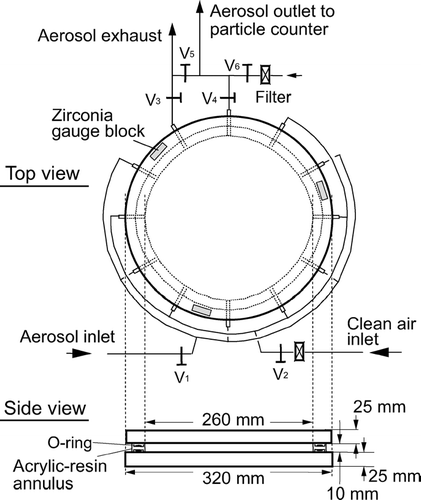
FIG. A1 Examples of temperature drift during the holding time on the back faces of the upper and lower electrodes. In the measurement of the No. 1 and No. 2 curves, thermistors A and B were used for the lower and upper electrodes, respectively, while in the measurements of the No. 3 and No. 4 curves, the two thermistors were exchanged.
Reprints and Corporate Permissions

Please note: Selecting permissions does not provide access to the full text of the article, please see our help page How do I view content?

To request a reprint or corporate permissions for this article, please click on the relevant link below:

Academic Permissions

Please note: Selecting permissions does not provide access to the full text of the article, please see our help page How do I view content?

Obtain permissions instantly via Rightslink by clicking on the button below:

If you are unable to obtain permissions via Rightslink, please complete and submit this Permissions form. For more information, please visit our Permissions help page.