Figures & data
FIG. 1 Time sequence of pollen rupture (1 frame every 1 s) from video light microscopy. Fresh Chinese elm pollen was placed in a drop of water; the first photo was taken after 33 minutes. Scale bar = 15 μm.
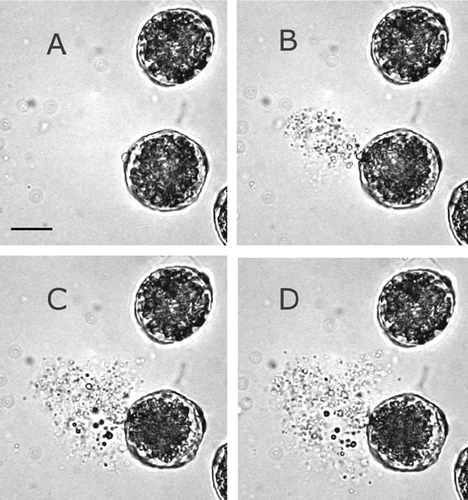
FIG. 2 Emissions from Chinese elm flowers housed within a controlled emission chamber showing the number size distribution, of pollen grains, collapsed pollen, and pollen cytoplasmic fragments released into each cubic centimeter of sampled air.
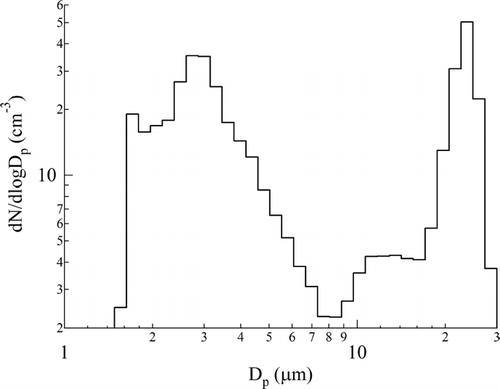
FIG. 3 Immuno-dot blot analysis of Chinese elm pollen antigens in fine particles (Dp < 2 μm) collected from the controlled emission chamber, and from outdoor air samples. Samples (and air volume sampled per spot): (A) indoor chamber (20 1); (B) Ambient (870 1); (C) Field—disturbed trees (50 1); (D) Ambient (190 1).
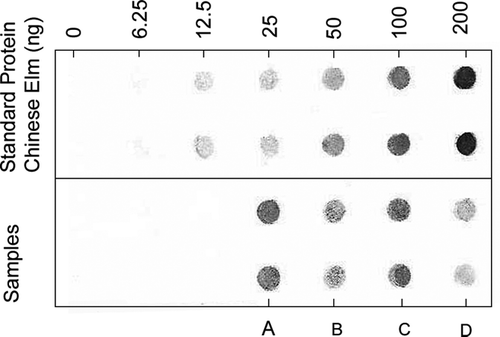
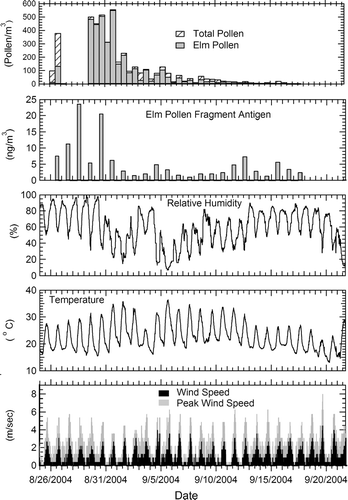
FIG. 4 Total pollen count, Chinese elm pollen count, and concentration of fine-sized Chinese elm pollen antigens (Dp < 2 μm), in ambient air samples compared with meteorological parameters during the 2004 Chinese elm bloom that began in August 25. Pollen counts from the night (11 PM–11 AM) and day (11 AM–11 PM) are given per cubic meter of air, 12 h averaged. Concentrations of elm pollen antigen are expressed per cubic meter, and were sampled during the day (8 h). Comparisons are made with relative humidity (RH), temperature (T), and wind speed.