Figures & data
TABLE 1 Particle numbers at 50 km/h, 100 km/h and on the NEDC, upstream and downstream DPFs and blank measurements for the different DPF used. The S content of the fuel is in brackets beside the DPF name. The ELPI, CPC, and EEPS LOD values are 5.3E+10, 2E+07, and 6E+10 1/km, respectively, while the corresponding LOQ values are 1.5E+11, 6E+07, and1.8E+11 1/km
FIG. 1 Comparison between total particle numbers determined by CPC, ELPI, ELPI > 30 nm, EEPS, and EEPS > 30 nm. (a) CPC basis; (b) ELPI basis; (c) EEPS basis.
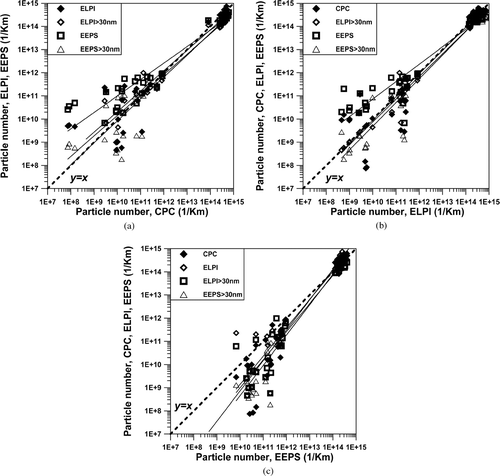
FIG. 2 Particle number versus time measured by CPC, ELPI, and EEPS. Average value for all tests upstream and downstream DPF on NEDC.
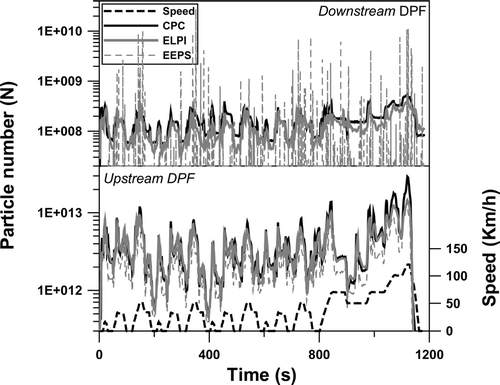
FIG. 3 ELPI and EEPS particle number versus CPC particle number on NEDC tests. Average value for all tests upstream and downstream DPF.
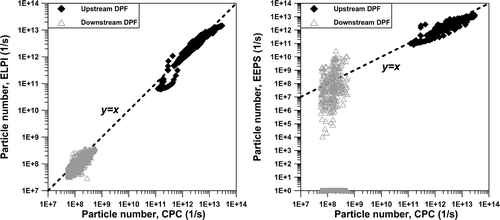
FIG. 4 Median particle diameter determined by ELPI and EEPS in the case of steady speeds and upstream DPF measurements. M: average value. The three bars of the M bars correspond to the min, average, and max values. Min and max values determined as: min = average value − 1.96*standard deviation, max = average value + 1.96*standard deviation.
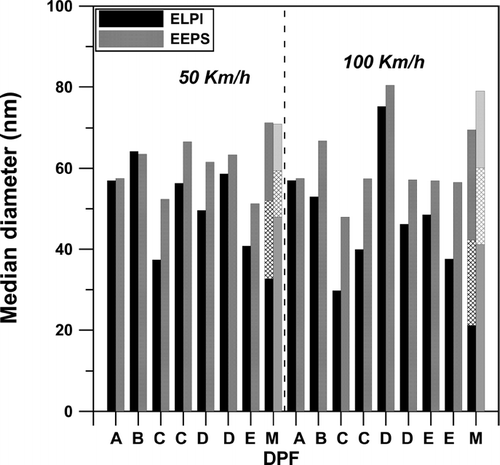
FIG. 5 Particle distribution of ELPI and EEPS in the case of steady speeds. Average distribution of all experiments upstream DPF.
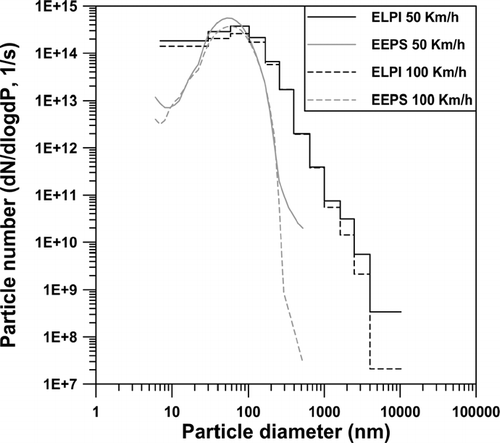
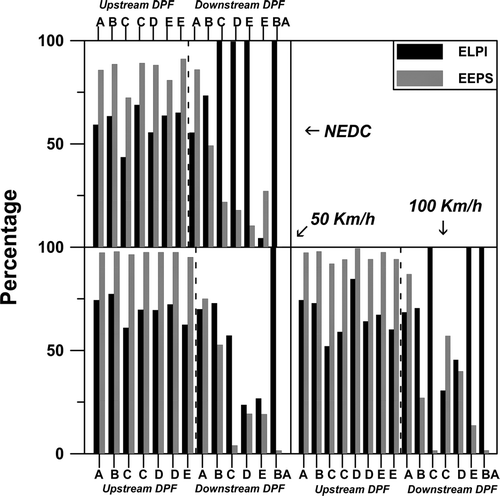
FIG. 6 Percentage of ELPI > 30 nm and EEPS > 30 nm comparing to ELPI and EEPS for the steady speeds of 50 and 100 km/h and NEDC tests for the different DPFs used. Experiments upstream and downstream DPF; BA: blank air experiments.