751
Views
3
CrossRef citations to date
0
Altmetric
Original Articles

A New Filter Cassette for the Direct Microscopic Examination of Airborne Fungal Spores

Pages 1025-1033 | Received 24 Apr 2006, Accepted 01 Jun 2006, Published online: 01 Feb 2007

Figures & data

FIG. 1 Arrangement of the six sample ports in the test section of the settling chamber, with alternating AOC and BA cassettes attached.
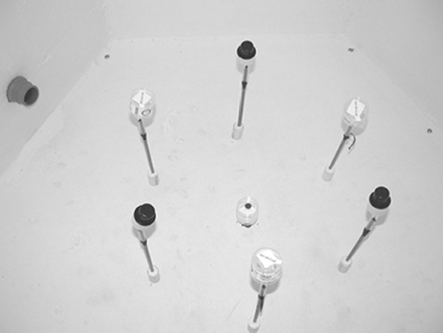
FIG. 1 Arrangement of the six sample ports in the test section of the settling chamber, with alternating AOC and BA cassettes attached.

FIG. 2 Side view of the BA filter cassette showing one of the 3-mm square sample inlets.

FIG. 2 Side view of the BA filter cassette showing one of the 3-mm square sample inlets.

FIG. 3 Interior of the BA cassette cowl showing the positions of the duplicate sample traces.

FIG. 3 Interior of the BA cassette cowl showing the positions of the duplicate sample traces.

TABLE 1 The average spore concentrations (spores/m3) and variability per injection of the alcohol spore suspension into the chamber. The data are for multiple series of 6, 12, 15, and 20 injections

TABLE 2 Variability of P. chrysogenum spore concentrations between the six sampling ports in the settling chamber for a single 10-minute test

FIG. 4 The corner of a typical BA sample trace at 100× magnification. The sample trace was well defined and the 1.7 mm × 5.5 mm area did not vary between samples.
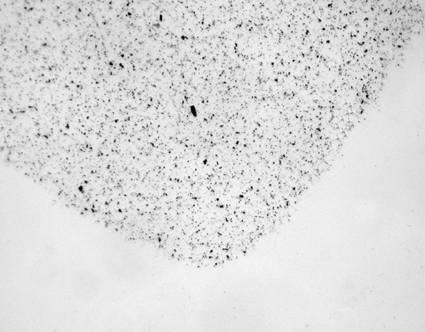
FIG. 4 The corner of a typical BA sample trace at 100× magnification. The sample trace was well defined and the 1.7 mm × 5.5 mm area did not vary between samples.

FIG. 5 The corner of a typical AOC sample trace at 100× magnification. The edges of the sample trace were diffuse and the 2 mm × 14.5 mm area often varied between samples.
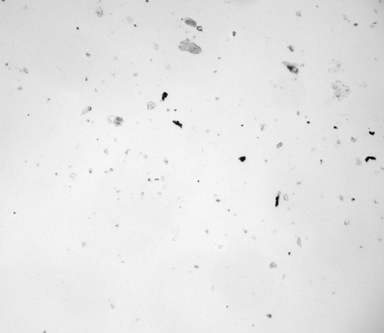
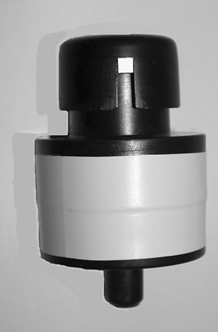
FIG. 5 The corner of a typical AOC sample trace at 100× magnification. The edges of the sample trace were diffuse and the 2 mm × 14.5 mm area often varied between samples.
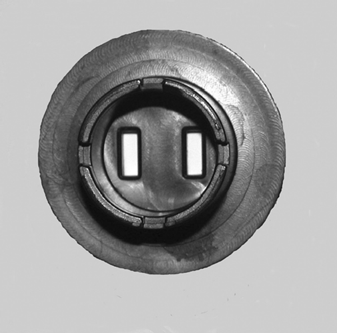
TABLE 3 The CV between microscopic traverses for six representative sample traces with various spore densities. An average of 11 traverses for AOC samples and 10 traverses for BA samples

TABLE 4 Effect of filter pore size on collection efficiency for Penicillium and Stachybotrys Spores

TABLE 5 Effect of airflow rate on spore retention for the Bi-Air cassette. Average Penicillium concentrations (spores/m3) for 30-minute tests at airflow rates of 1, 2 and 3 lpm

Reprints and Corporate Permissions

Please note: Selecting permissions does not provide access to the full text of the article, please see our help page How do I view content?

To request a reprint or corporate permissions for this article, please click on the relevant link below:

Academic Permissions

Please note: Selecting permissions does not provide access to the full text of the article, please see our help page How do I view content?

Obtain permissions instantly via Rightslink by clicking on the button below:

If you are unable to obtain permissions via Rightslink, please complete and submit this Permissions form. For more information, please visit our Permissions help page.