Figures & data
FIG. 1 The system of coordinates and the geometry of the room in the model calculations (a). Trajectories of particle movement under “no external wind” conditions at the section y = 9 m (b); trajectories of particle movement at the section y = 9 m in the presence of a pressure differential due to external wind presence (c).
FIG. 2 Particles trajectories projected on the horizontal plane under “no external wind” conditions (a), and presence of the wind pressure on the building (b). Isolines of normalized concentration values C n at the section y = 9 m under “no external wind” conditions (c).
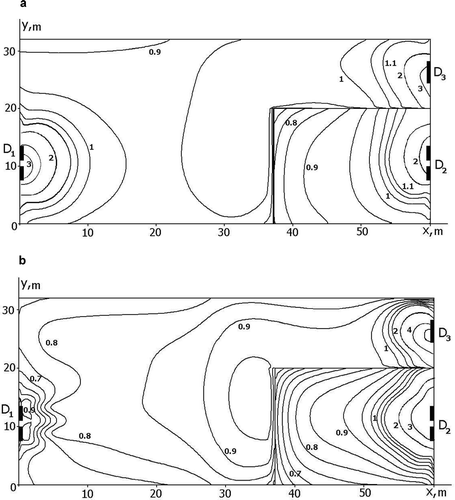
FIG. 3 Isolines of normalized values of virus-containing aerosol concentration C n at the height of 1.5 m from the floor calculated for “no external wind” conditions (a); and the presence of the wind pressure on the building (b).