Figures & data
Figure S1 Calibration curve of the measured fluorescence of standard H2O2 solutions, where M is the molarity of the solution.
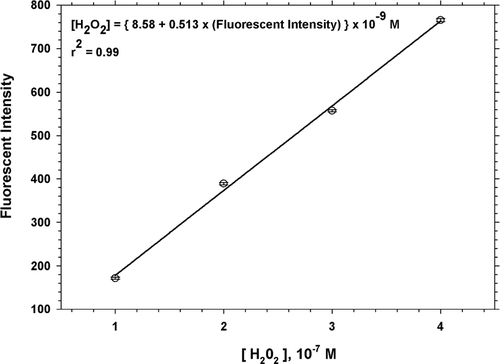
TABLE 1 ROS concentrations over the various size fractions of the Flushing aerosol, during the four sampling periods
FIG. 1 Diurnal variations of (a) mean total particulate ROS concentrations and (b) mean stagewise ROS concentrations.
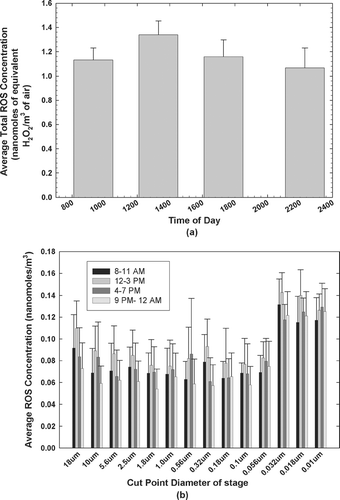
Figure S2 (a) Stagewise concentration distribution curve, and (b) scatter plot of the total ROS concentration in the Nano-MOUDI stages versus the total ROS concentration in the MOUDI stages.
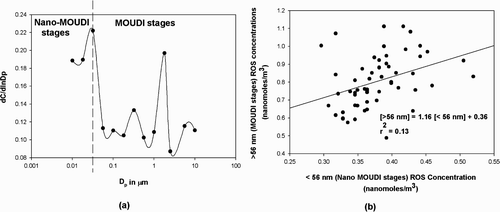
FIG. 2 Regression graphs showing correlation between mean ozone concentrations and mean total particulate ROS concentrations during the three daytime sampling periods.
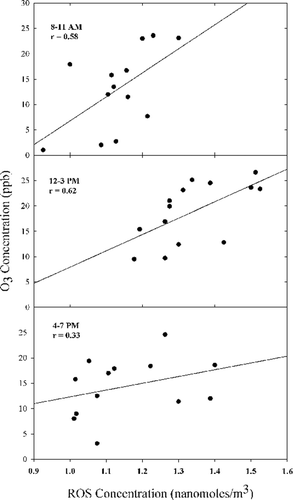
Figure S3 Regression graphs showing correlation between measured EC concentrations and mean total particulate ROS concentrations during the sampling periods.
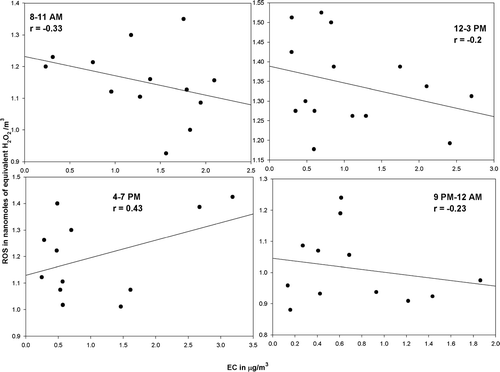
Figure S4 Regression graphs showing correlation between measured OC concentrations and mean total particulate ROS concentrations during the sampling periods.
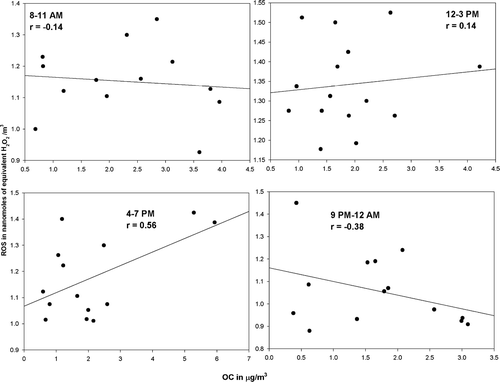
FIG. 3 Regression graphs showing correlation between estimated SOC concentrations and mean total particulate ROS concentrations during the sampling periods.
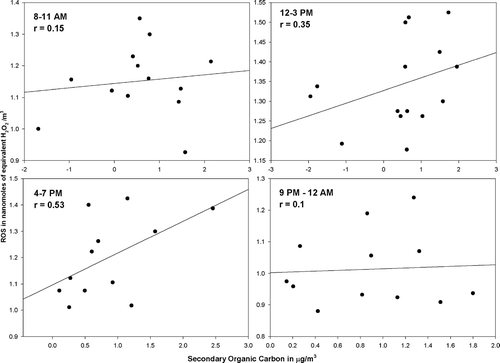
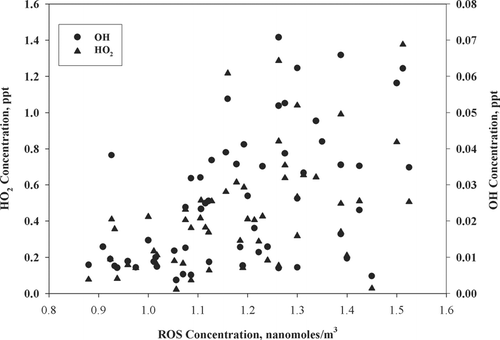
FIG. 4 Scatter plot of mean total particulate ROS with gas phase OH and HO2 radical concentrations over the period of sampling.