2,990
Views
78
CrossRef citations to date
0
Altmetric
Original Articles

Dispersion of Expiratory Droplets in a General Hospital Ward with Ceiling Mixing Type Mechanical Ventilation System

, , , &
Pages 244-258 | Received 01 Mar 2006, Accepted 30 Nov 2006, Published online: 17 Jan 2007

Figures & data

FIG. 1 Schematic diagram of the experimental ward and the IMI measurement setup.

FIG. 1 Schematic diagram of the experimental ward and the IMI measurement setup.

TABLE 1 Boundary conditions and parameter inputs for the numerical simulations

TABLE 2 Injection droplet size distribution used in the numerical simulations

FIG. 2 (a) Measured integral length scales at different locations. (b) Measured integral time scales at different locations.
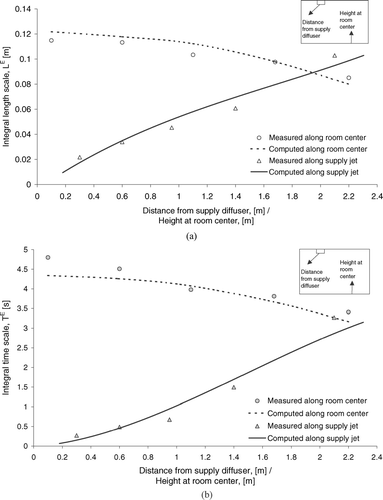
FIG. 2 (a) Measured integral length scales at different locations. (b) Measured integral time scales at different locations.

FIG. 3 Schematic of the droplet generator setup.

FIG. 3 Schematic of the droplet generator setup.

FIG. 4 Droplet size distribution measured at the droplet generator.

FIG. 4 Droplet size distribution measured at the droplet generator.

FIG. 5 Grid of measurement positions for droplet dispersion experiments.

FIG. 5 Grid of measurement positions for droplet dispersion experiments.

FIG. 6 Decay in number fraction of selected size bins of droplets. Legends indicate initial droplet sizes.
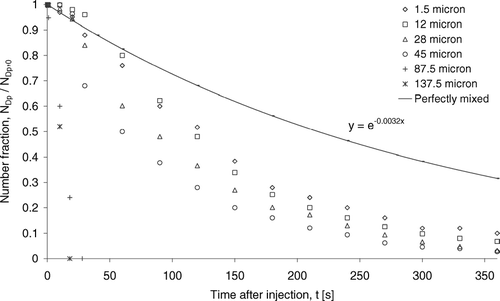
FIG. 6 Decay in number fraction of selected size bins of droplets. Legends indicate initial droplet sizes.

FIG. 7 Removal number fractions for selected size bins of droplets.

FIG. 7 Removal number fractions for selected size bins of droplets.

FIG. 8 Mean vertical positions of selected size bins of droplets. Legends and indicators are initial droplet sizes.
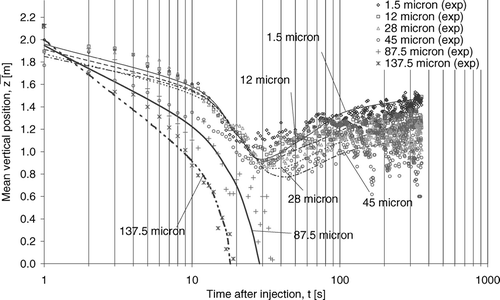
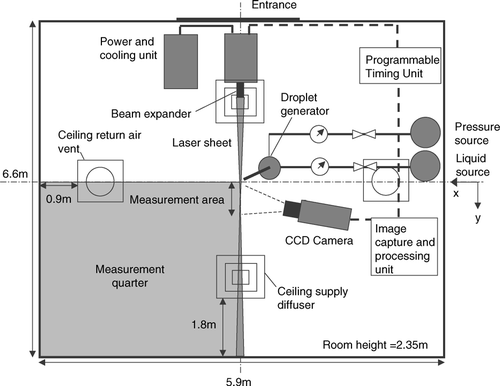
FIG. 8 Mean vertical positions of selected size bins of droplets. Legends and indicators are initial droplet sizes.
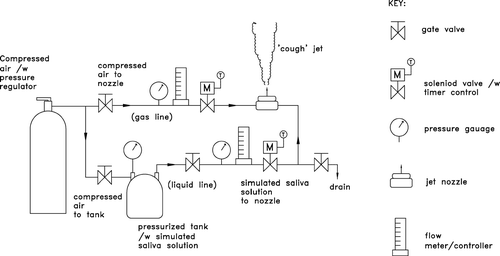
FIG. 9 (a) Mean dispersion distances of selected size bins of droplets in X direction. Legends and indicators are initial droplet sizes. (b) Mean dispersion distances of selected size bins of droplets in Y direction. Legends and indicators are initial droplet sizes.
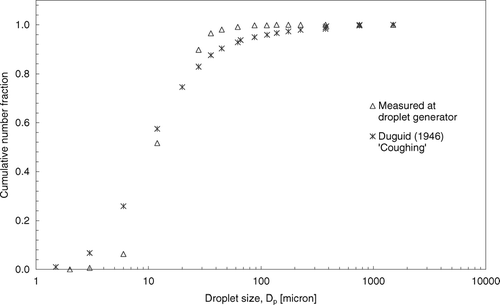
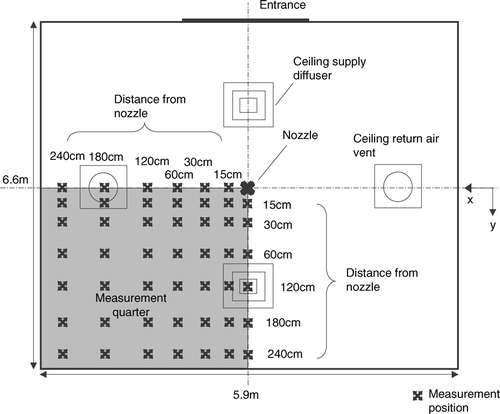
FIG. 9 (a) Mean dispersion distances of selected size bins of droplets in X direction. Legends and indicators are initial droplet sizes. (b) Mean dispersion distances of selected size bins of droplets in Y direction. Legends and indicators are initial droplet sizes.
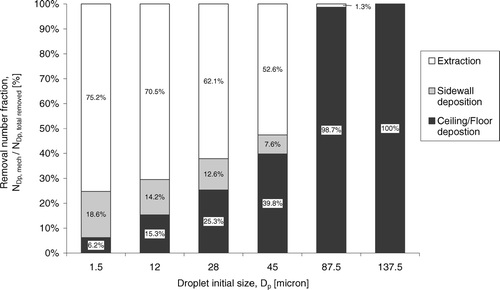
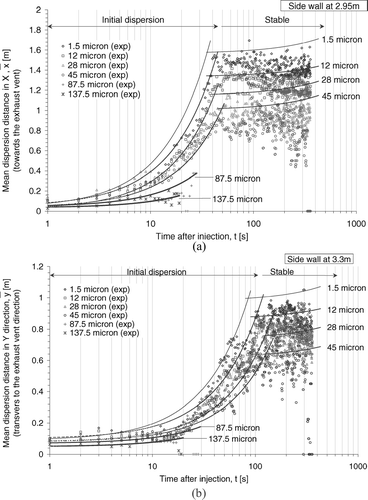
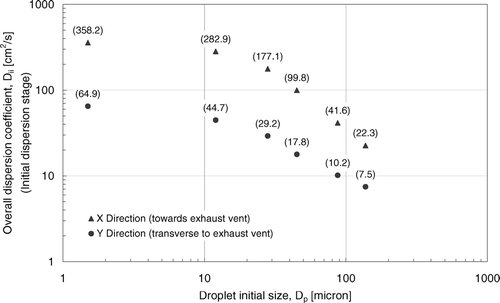
FIG. 10 Overall dispersion coefficients of selected size bins in the initial dispersion stage.

FIG. 10 Overall dispersion coefficients of selected size bins in the initial dispersion stage.

Reprints and Corporate Permissions

Please note: Selecting permissions does not provide access to the full text of the article, please see our help page How do I view content?

To request a reprint or corporate permissions for this article, please click on the relevant link below:

Academic Permissions

Please note: Selecting permissions does not provide access to the full text of the article, please see our help page How do I view content?

Obtain permissions instantly via Rightslink by clicking on the button below:

If you are unable to obtain permissions via Rightslink, please complete and submit this Permissions form. For more information, please visit our Permissions help page.