Figures & data
FIG. 1 Photograph of the DAWN-A optical assembly showing the argon-ion laser, light-scattering chamber, and fiber-optic detectors. Azimuthal (φ) and polar (θ) angular coordinate directions are indicated by arrows.
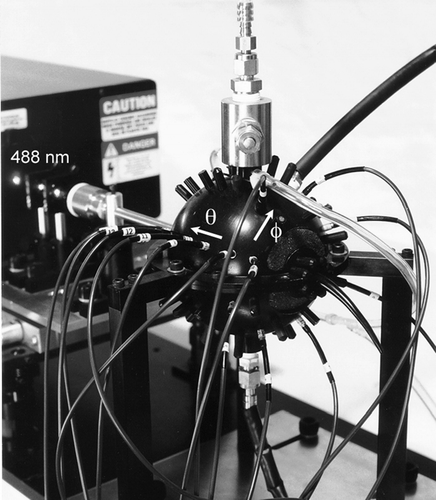
FIG. 2 Schematic diagram of the flow system used for generation and sampling of calibration particles.
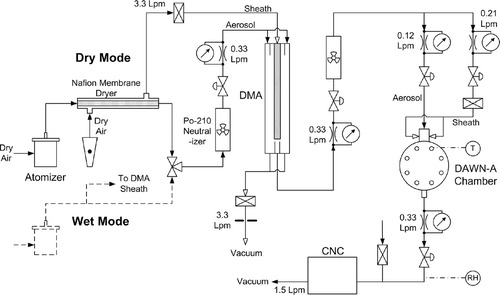
FIG. 3 RH-dependent refractive index of sulfuric acid and ammonium sulfate derived from partial molar refractions at λ = 488 nm.
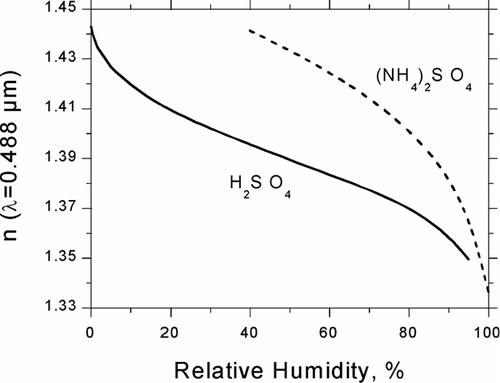
TABLE 1 Cauchy dispersion parameters, values of n calculated from the Cauchy formula
FIG. 4 Responses to six different 0.3-μ m calibration particles vs. Lorenz-Mie theoretical dimensionless irradiances calculated for polar angles θ = 55° and 75°.
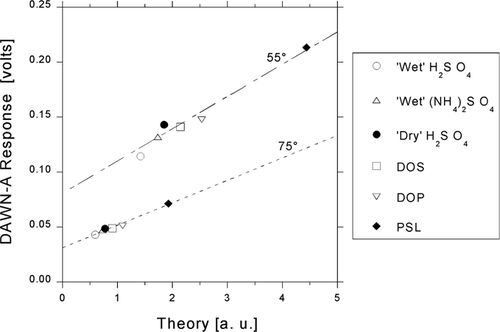
FIG. 5 Example of the χ2-best-fit inference of the real component of refractive index shown for a 0.3-μ m ammonium sulfate droplet. Scattering diagrams calculated with Lorenz-Mie theory are shown for the expected refractive index (broken line) and the inverted refractive index (solid line).
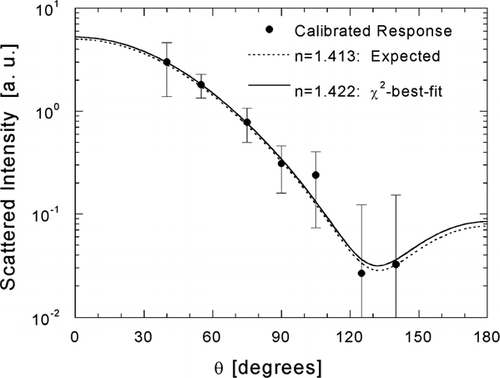
TABLE 2 Errors in inferred refractive indices (inferred-expected) for calibration particles. For the values shown, shape distinction was not applied to the measurements prior to their inversion
Table 3 Errors in inferred refractive indices (inferred-expected) for light-absorbing DPS particles measured during the SEAVS field study. The values shown are for selected spherical subfractions to which laboratory/field “hybrid” calibrations were applied. The expected real part of the refractive index is n = 1.449
FIG. 6 Sensitivity of angular scattering to the real and imaginary components of the complex refractive index, illustrated with scattering diagrams calculated for a matrix of refractive indices defined by real values n = 1.40 and 1.45 and imaginary values k = 0.000 and 0.010.
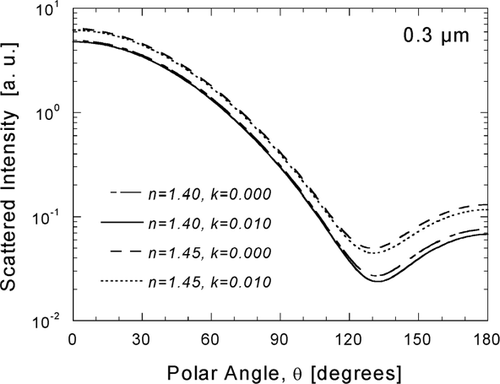
FIG. 7 Inference of size-dependent atmospheric particle refractive index from χ2-best-fits of Mie theory to calibrated responses. Angular scattering patterns are compared for wet and dry samples for D p = 0.2 μ m (a), 0.3 μ m (b), 0.4 μ m (c), and 0.5 μ m (d).
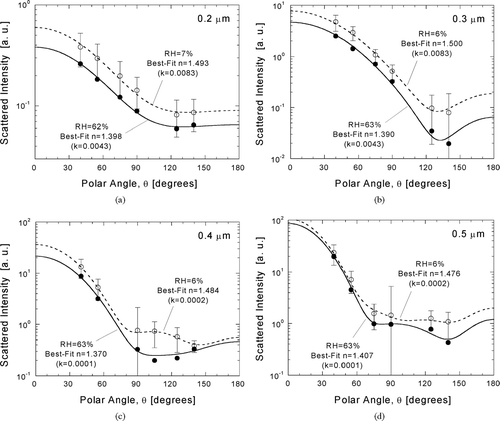
FIG. 8 Inference of atmospheric particle refractive from a χ2-best-fit of Mie theory to calibrated response for D p = 0.8 μ m. The angular scattering pattern for the inferred value (solid line) is compared to patterns calculated for water (dotted line) and crystalline ammonium sulfate (dashed line).
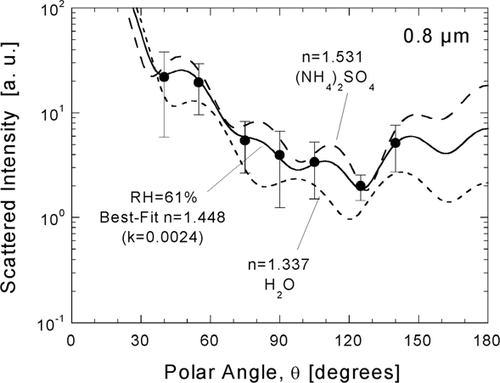
TABLE 4 Species properties assumed for refractive index modeling. Refractive index real and imaginary components n and k are specified for a wavelength of λ = 488 nm
TABLE 5 Properties used for modeling refractive index of dry (∼ 0% RH) ammoniated sulfate. Properties of ammonium bisulfate and letovicite were determined from interpolation of sulfuric acid and ammonium sulfate properties, where the ammonium-to-sulfate molar ratio, B, is the dependent variable. Values of R and n are for λ = 488 nm unless indicated otherwise
FIG. 9 Study-average dry Δ n values resulting from variation of dry OC n. The size-average of these values is minimized for OC n = 1.45 (average Δ n = −0.0003 among the sizes shown).
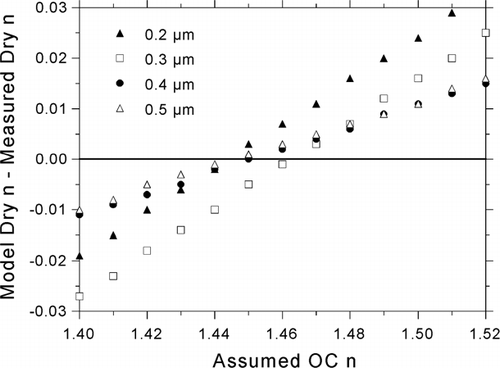
TABLE 6 Size-dependent, study-averaged real refractive indices n measured at RH = 4–10% (dry) and results from comparison with modeled values. Assumed properties for dry organics are ρ = 1.4 and n = 1.46
TABLE 7 Size-dependent, study-averaged real refractive indices measured at RH = 44–76% (wet) and results from comparison with modeled values. Assumed properties for dry organics are ρ = 1.4 and n = 1.46
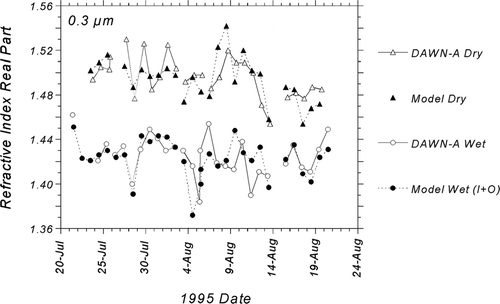
FIG. 10 Comparison of modeled refractive indices with atmospheric refractive indices measured by the DAWN-A during SEAVS for D p = 0.3 μ m. Two estimates of water content are compared for wet indices: thermodynamically predicted water associated with supersaturated ammoniated sulfates (I; inorganic contribution), and the sum of the inorganic contribution and water content associated with organics (I+O).
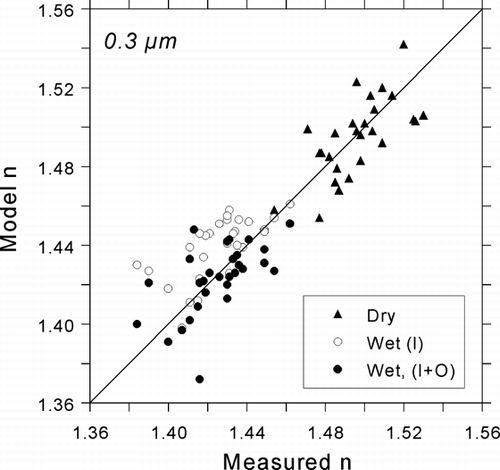
FIG. 11 Time-series comparisons of modeled refractive indices with atmospheric refractive indices measured by the DAWN-A during SEAVS for D p = 0.3 μ m. For wet indices, modeled water content includes contributions from both inorganic and organic aerosol fractions (I+O).