694
Views
14
CrossRef citations to date
0
Altmetric
Original Articles

A New Field-Compatible Methodology for the Collection and Analysis of Fungal Fragments

, , , , &
Pages 794-803 | Received 11 Jan 2007, Accepted 18 May 2007, Published online: 06 Jul 2007

Figures & data

FIG. 1 Experimental setup: OPC = Optical Particle Counter; CNC = Condensation Nucleus Counter. Q = the air flow rate (l min− 1).
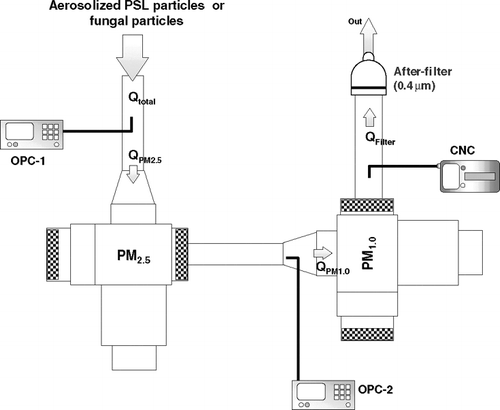
FIG. 1 Experimental setup: OPC = Optical Particle Counter; CNC = Condensation Nucleus Counter. Q = the air flow rate (l min− 1).

FIG. 2 PSL particle penetration curves and their corresponding 50% penetration values for the Sharp-Cut cyclone samplers at a flow rate of 19.3 l min− 1 for PM2.5 and 17.4 l min− 1 for PM1.0. Each data point presents the average of three repeated experiments. The error bars represent standard deviations calculated for each group.
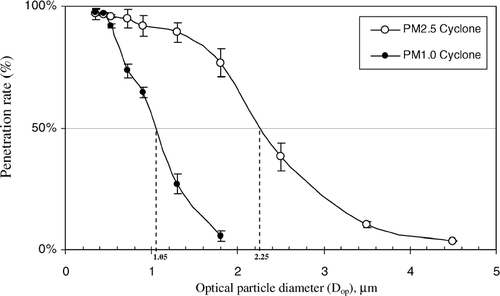
FIG. 2 PSL particle penetration curves and their corresponding 50% penetration values for the Sharp-Cut cyclone samplers at a flow rate of 19.3 l min− 1 for PM2.5 and 17.4 l min− 1 for PM1.0. Each data point presents the average of three repeated experiments. The error bars represent standard deviations calculated for each group.

FIG. 3 Spore number collected on the after-filter as a function of the total particle number entering the collection system as measured with the OPC-1. The dotted line represents the lower detection limit of spore numbers (55 spores).
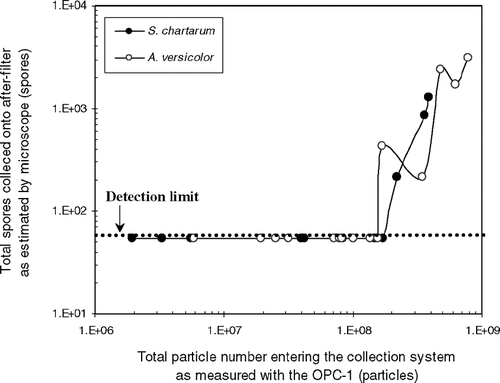
FIG. 3 Spore number collected on the after-filter as a function of the total particle number entering the collection system as measured with the OPC-1. The dotted line represents the lower detection limit of spore numbers (55 spores).

FIG. 4 Comparison of fungal particles released from cultures grown on 5 or 20 ml of 2% MEA: (a) A. versicolor; (b) S. chartarum. Each data point presents the average of three repeated experiments. The error bars represent standard deviations calculated for each group.
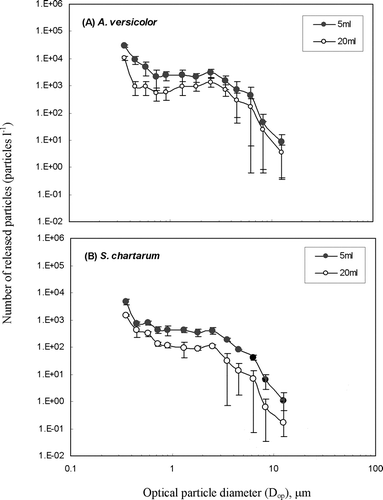
FIG. 4 Comparison of fungal particles released from cultures grown on 5 or 20 ml of 2% MEA: (a) A. versicolor; (b) S. chartarum. Each data point presents the average of three repeated experiments. The error bars represent standard deviations calculated for each group.

FIG. 5 (1 → 3)-β-D-glucan assay results of samples collected from A. versicolor and S. chartarum into fragment and spore size fractions. (a) (1 → 3)-β-D-glucan concentration in the air (ng m− 3 air). (b) Particle number concentration (particles m− 3 air) in the air. (c) Particle-specific (1 → 3)-β-D-glucan content (ng particle− 1). The histograms present the averages of three repeated experiments. The error bars represent the standard deviations calculated for each group.
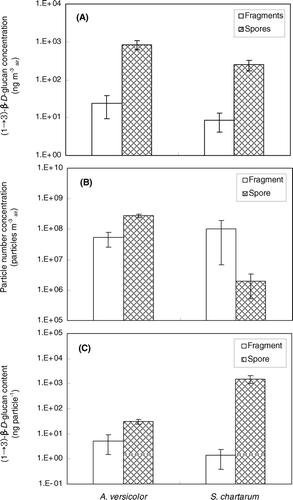
FIG. 5 (1 → 3)-β-D-glucan assay results of samples collected from A. versicolor and S. chartarum into fragment and spore size fractions. (a) (1 → 3)-β-D-glucan concentration in the air (ng m− 3 air). (b) Particle number concentration (particles m− 3 air) in the air. (c) Particle-specific (1 → 3)-β-D-glucan content (ng particle− 1). The histograms present the averages of three repeated experiments. The error bars represent the standard deviations calculated for each group.
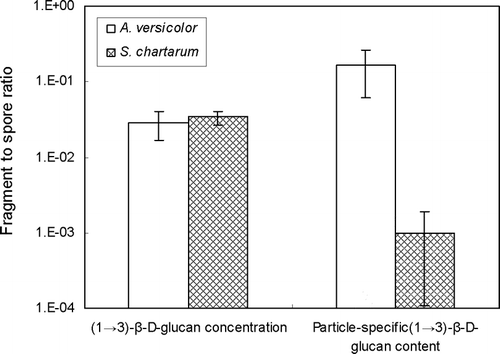
FIG. 6 (1 → 3)-β-D-glucan ratios of fragment to spore size fractions. (1 → 3)-β-D-glucan concentration ratio means (ngfm− 3) ÷ (ngsm− 3) and particle-specific (1 → 3)-β-D-glucan content ratio means (ngf particlef − 1) ÷ (ngs particles − 1), where ngf = (1 → 3)-β-D-glucan mass in the fragment size fraction; ngs = (1 → 3)-β-D-glucan mass in the spore size fraction; particlef = particle number in the fragment size fraction; particles = particle number in the spore size fraction. The histograms present the averages of three repeated experiments. The error bars represent the standard deviations calculated for each group.

FIG. 6 (1 → 3)-β-D-glucan ratios of fragment to spore size fractions. (1 → 3)-β-D-glucan concentration ratio means (ngfm− 3) ÷ (ngsm− 3) and particle-specific (1 → 3)-β-D-glucan content ratio means (ngf particlef − 1) ÷ (ngs particles − 1), where ngf = (1 → 3)-β-D-glucan mass in the fragment size fraction; ngs = (1 → 3)-β-D-glucan mass in the spore size fraction; particlef = particle number in the fragment size fraction; particles = particle number in the spore size fraction. The histograms present the averages of three repeated experiments. The error bars represent the standard deviations calculated for each group.

TABLE 1 The (1 → 3)-β-D-glucan content per total surface area of fungal particles

FIG. 7 Results of linear regression analysis. (A) Total particle number (#) versus total (1 → 3)-β-D-glucan content per sample (ng). (B) Total surface area of particle (μm2) versus total (1 → 3)-β-D-glucan content per sample.
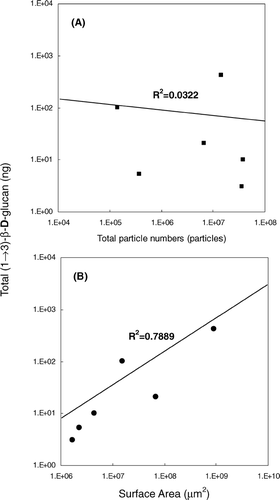
FIG. 7 Results of linear regression analysis. (A) Total particle number (#) versus total (1 → 3)-β-D-glucan content per sample (ng). (B) Total surface area of particle (μm2) versus total (1 → 3)-β-D-glucan content per sample.

Reprints and Corporate Permissions

Please note: Selecting permissions does not provide access to the full text of the article, please see our help page How do I view content?

To request a reprint or corporate permissions for this article, please click on the relevant link below:

Academic Permissions

Please note: Selecting permissions does not provide access to the full text of the article, please see our help page How do I view content?

Obtain permissions instantly via Rightslink by clicking on the button below:

If you are unable to obtain permissions via Rightslink, please complete and submit this Permissions form. For more information, please visit our Permissions help page.