Figures & data
FIG. 1 Schematic of experiment setup for the flame synthesis of iron oxide nanoparticles.
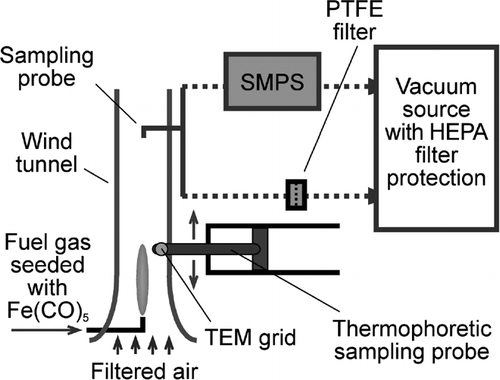
FIG. 2 TEM image of flame-synthesized iron oxide nanoparticles. Two distinct size modes are present. The large size mode is composed of crystalline particles with a median diameter of approximately 45 nm. The small size mode contained very small particles (3–8 nm) that were mostly amorphous. Arrows point to particles in the small size mode. 88 × 66 mm (400 × 400 DPI).
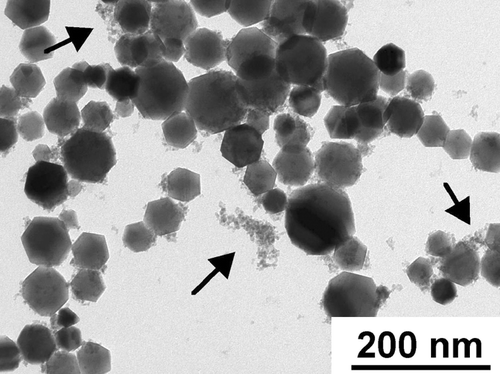
FIG. 3 Particle size distribution measured by Scanning Mobility Particle Sizer. 88 × 84 mm (300 × 300 DPI).
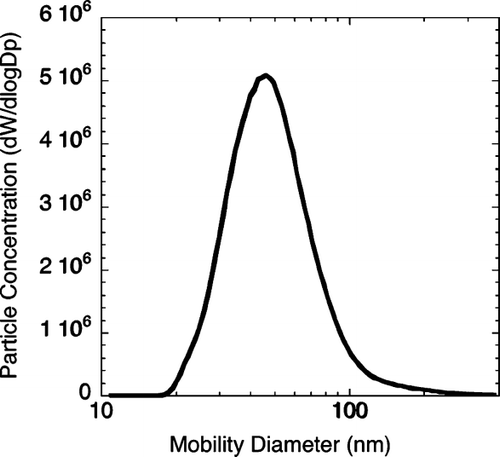
FIG. 4 High-resolution TEM image of particles of the small size mode and a large particle. 177 × 177 mm (400 × 400 DPI).
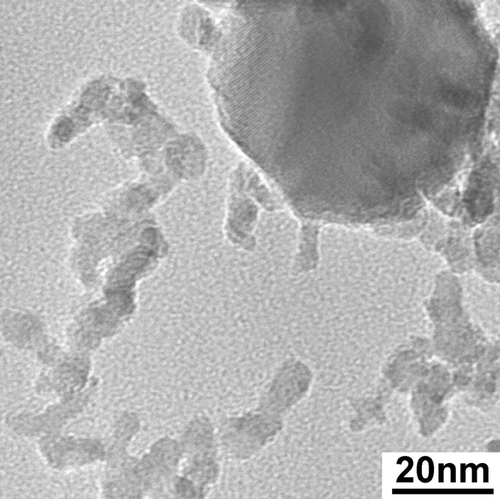
FIG. 5 XRD result of the iron oxide nanoparticles. The pattern is from flame-synthesized particles used for the health effects study (with bimodal size distribution). The vertical lines are the major lines from the JCPDS standard PDF #39-1346. 177 × 88 mm (300 × 300 DPI).
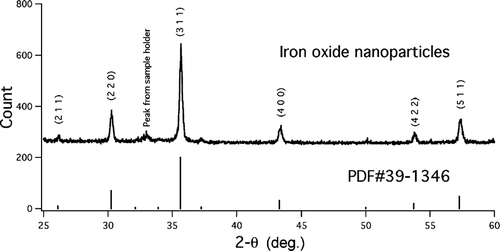
FIG. 6 Photograph of a H2 synthesis flame and TEM micrographs of iron oxide (or iron) particles taken from flame interior. The particles were sampled thermophoretically at 15 mm (A), 25 mm (B) and 35 mm (C) above the burner, respectively. For reference, the highest luminous tip of the flame is about 45 mm above the burner mouth. The micrographs indicate that particles of the small size mode started forming in the maximum temperature region in the flame. 88 × 104 mm (300 × 300 DPI).
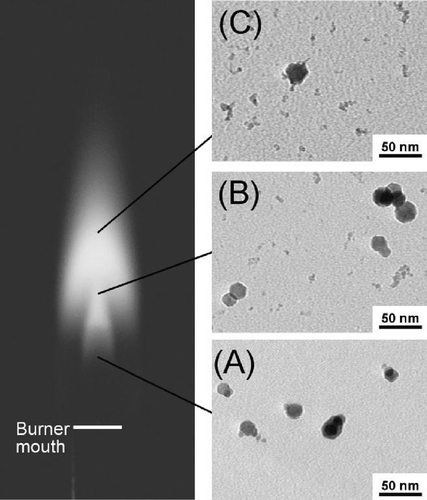
TABLE 1 Contributions from the small size mode at various values of dm_Small or (ds_Small)
FIG. 7 Scheme of chemical equilibrium calculation and results for representative points on flame axis. The flame temperature at each point was measured. The mixture fraction was back calculated from the measured flame temperature. The molar concentration of Fe(CO)5 in the fuel gas used in the calculation was 100 ppm. Letters in the parentheses indicate the phase of the species, g being gas-phase, and c condensates. Fe2O3 and Fe3O4 are always condensates. 88 × 158 mm (300 × 300 DPI).
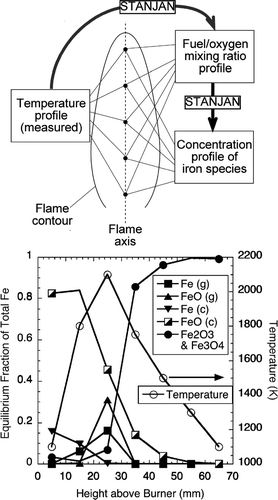
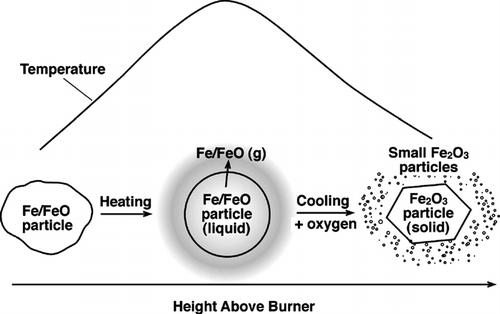
FIG. 8 Formation mechanism of the small mode iron oxide particles. 88 × 55 mm (300 × 300 DPI).