Figures & data
FIG. 1 Schematic diagram of the experimental setup.
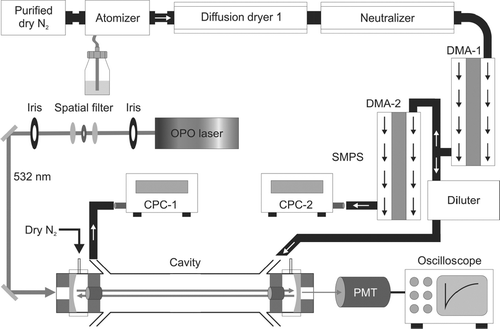
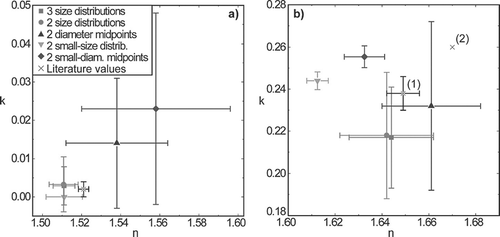
FIG. 2 Refractive indices of AS. In (a) all particle sizes are included in the retrieval procedure. The retrieved RIs of all possible combinations of 3 (squares) and 2 (circles) size distributions and of 2 diameter midpoints (triangles) are shown. (b) shows only the results for small particle diameters up to 275 nm. In both panels, the cross shows the literature value reported by CitationAbo Riziq et al. (2007). The deviation of the average of the circles in b from the reference is –0.7 % for n. Since all k are close to 0, giving a relative deviation for k has no meaning.
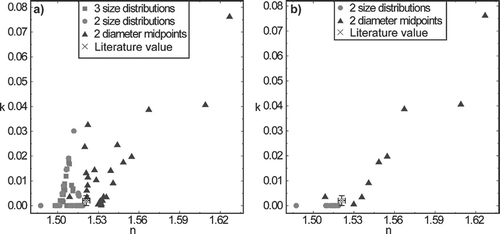
FIG. 3 Refractive indices of nigrosin. As in the panels show the search results for all particle sizes (a) and for small particles up to 250 nm (b). In both panels, the crosses show literature values value reported by CitationDinar et al (2007) and references therein. The deviation of the average of the circles in (b) from the reference is –2.2 % and +2.5 % for n and k, respectively.
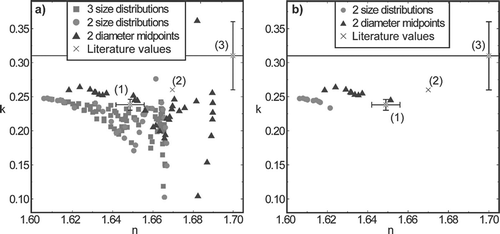
FIG. 4 Mean RIs for AS (a) and nigrosin (b) obtained by using different subsets of measurement points. The crosses correspond to literature values reported by CitationAbo Riziq et al. (2007) and by CitationDinar et al. (2007) and references therein.