Figures & data
TABLE 1 Vehicle test matrix
FIG. 1 Emissions of PM2.5 chemical species from four gasoline-powered motor vehicles operating over different driving cycles.
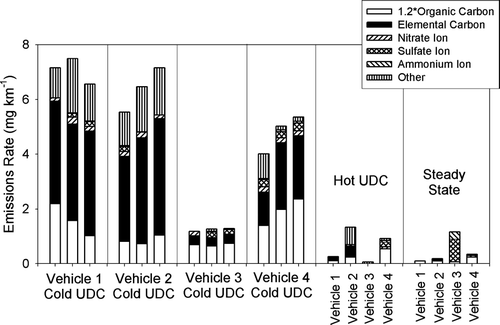
TABLE 2 Emissions rates of PM2.5 mass, OC, EC, sulfate ion, nitrate ion, and ammonium ion
FIG. 2 Particle mass size distributions of diluted vehicle exhaust emissions—measured with a nano-MOUDI impactor.
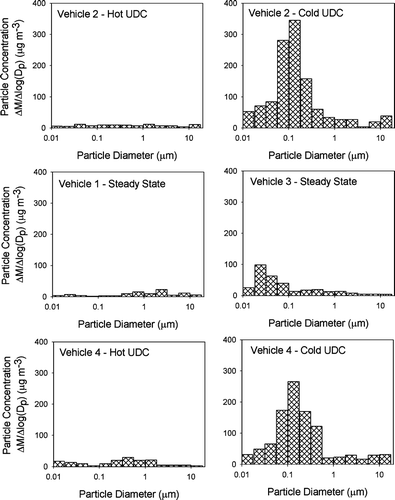
FIG. 3 The size resolved chemical composition of particle emissions from Vehicle 2 operating over the cold-cold start UDC driving cycle.
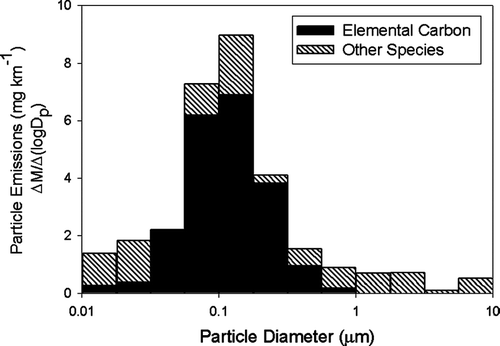
FIG. 4 The size resolved chemical composition of particle emissions from Vehicle 3 operating over the steady state driving cycle.
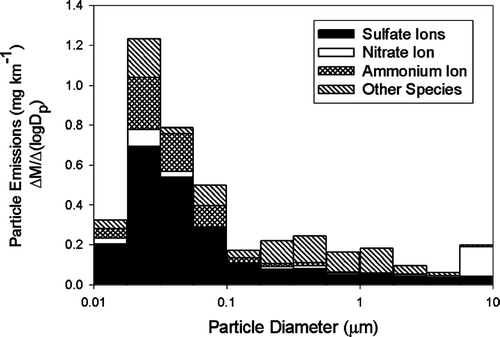
TABLE 3 Emissions rates of particle phase organic compounds
FIG. 5 Emissions of selected PM2.5 high molecular weight PAH compounds from four gasoline-powered vehicles operating over different driving cycles. Values shown as zero were below detection.
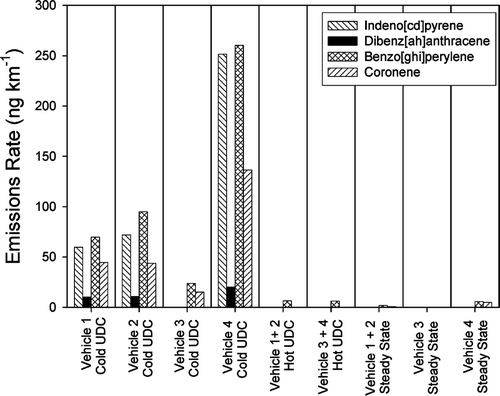
FIG. 6 Emissions of selected PM2.5 Hopane and Sterane compounds from four gasoline-powered vehicles operating over different driving cycles. Values shown as zero were below detection.
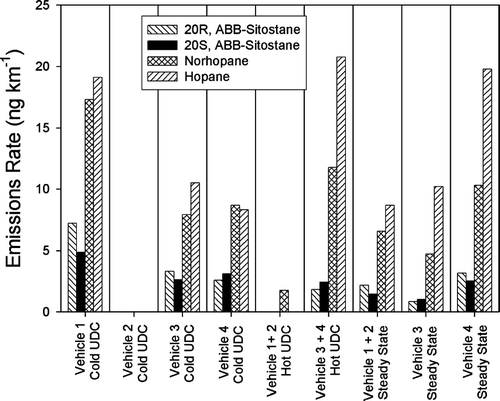
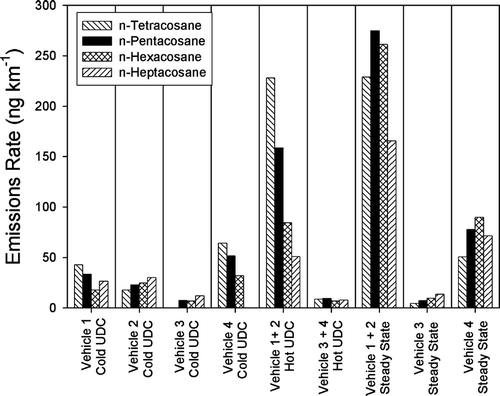
FIG. 7 Emissions of selected PM2.5 high molecular weight n-alkanes from four gasoline-powered vehicles operating over different driving cycles. Values shown as zero were below detection.